


Plugin information
| Version | 1.0.0 |
|---|---|
| Author | Dataiku |
| Released | 2020-05-18 |
| Last updated | 2020-05-18 |
| License | Apache Software License |
| Source code | Github |
| Reporting issues | Github |
Description
- This plugin adds a custom chart: the waterfall chart.
- Waterfall charts are useful to visualize the cumulative value of different categories that have either positive or negative values. They are quite similar to categorical histogram using cumulative values.
- DSS 7.0.1 or newer is required
How to use
- This chart is based on the Google Charts library and requires internet access to render on your datasets.
- This new visualization is provided as custom charts and is available in the “Other” tab of the chart type selector.
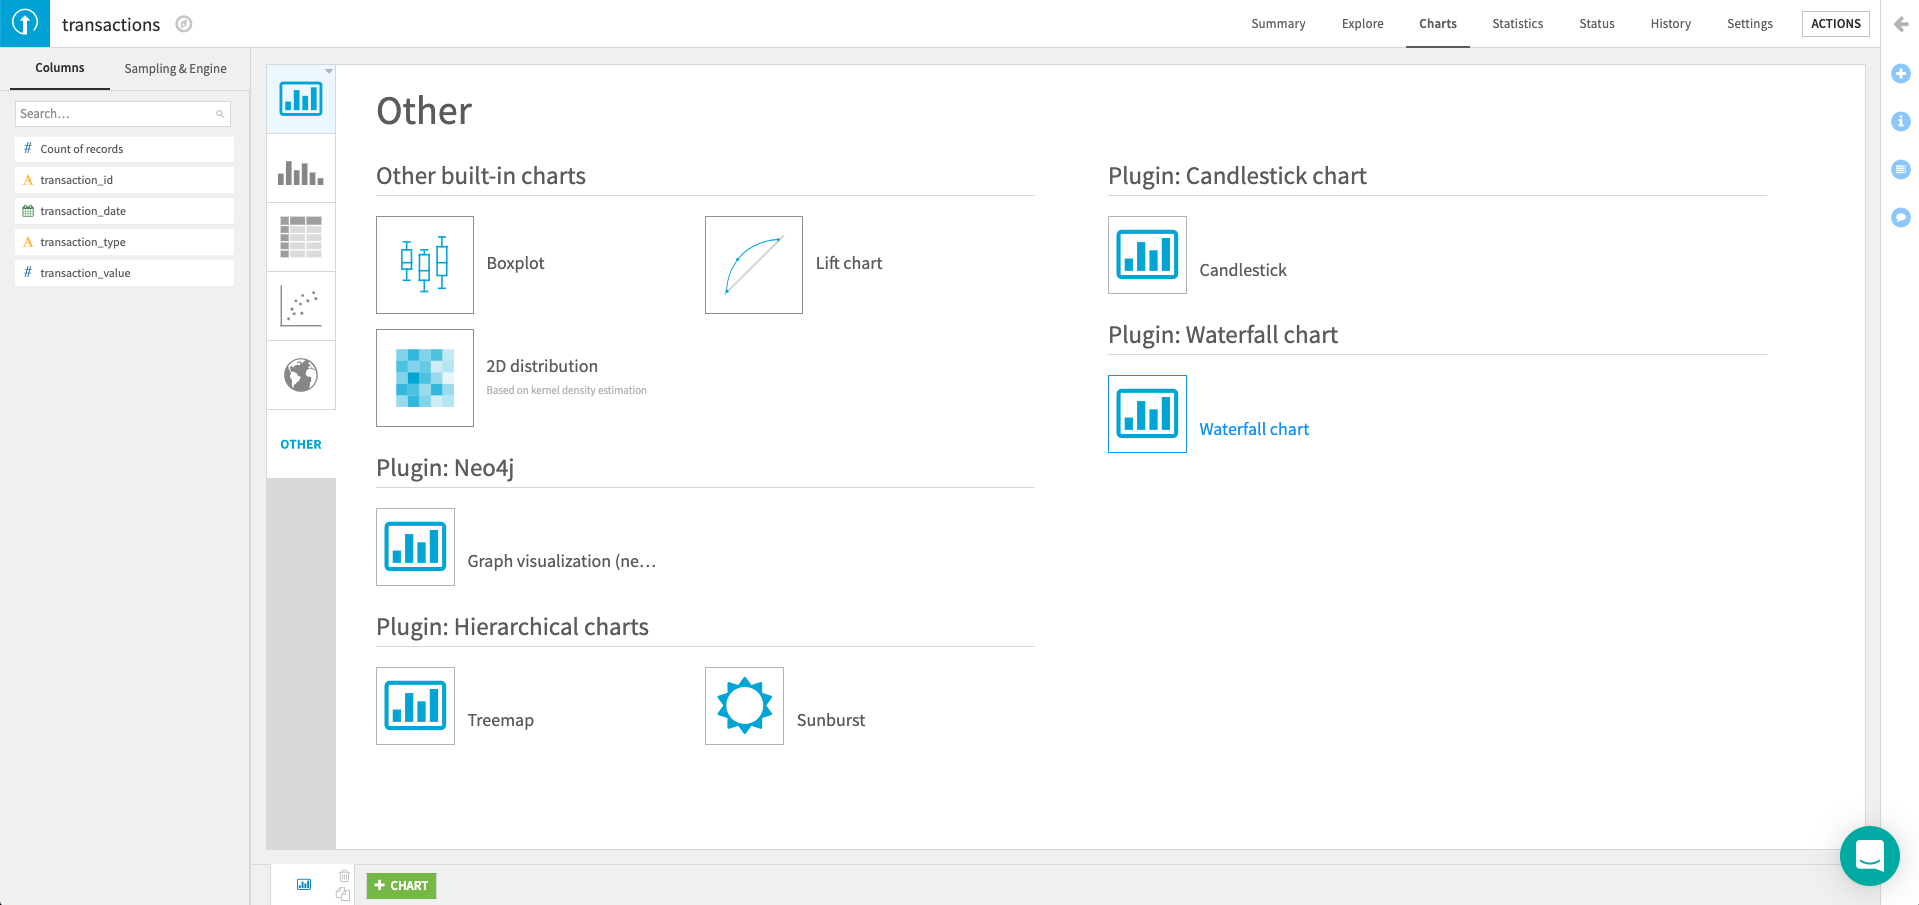
The other charts page.
- The By categories (X) column corresponds to the different categories on which values are aggregated.
- The Show values (Y) column corresponds to the variable that is summed for each category.
Example
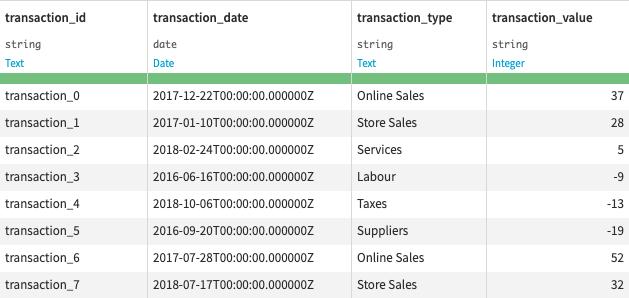
For instance, in a dataset with transactions of different categories and values:
The Waterfall chart with transaction_type as the By categories (X) column and with transaction_value as the Show values (Y) column is:
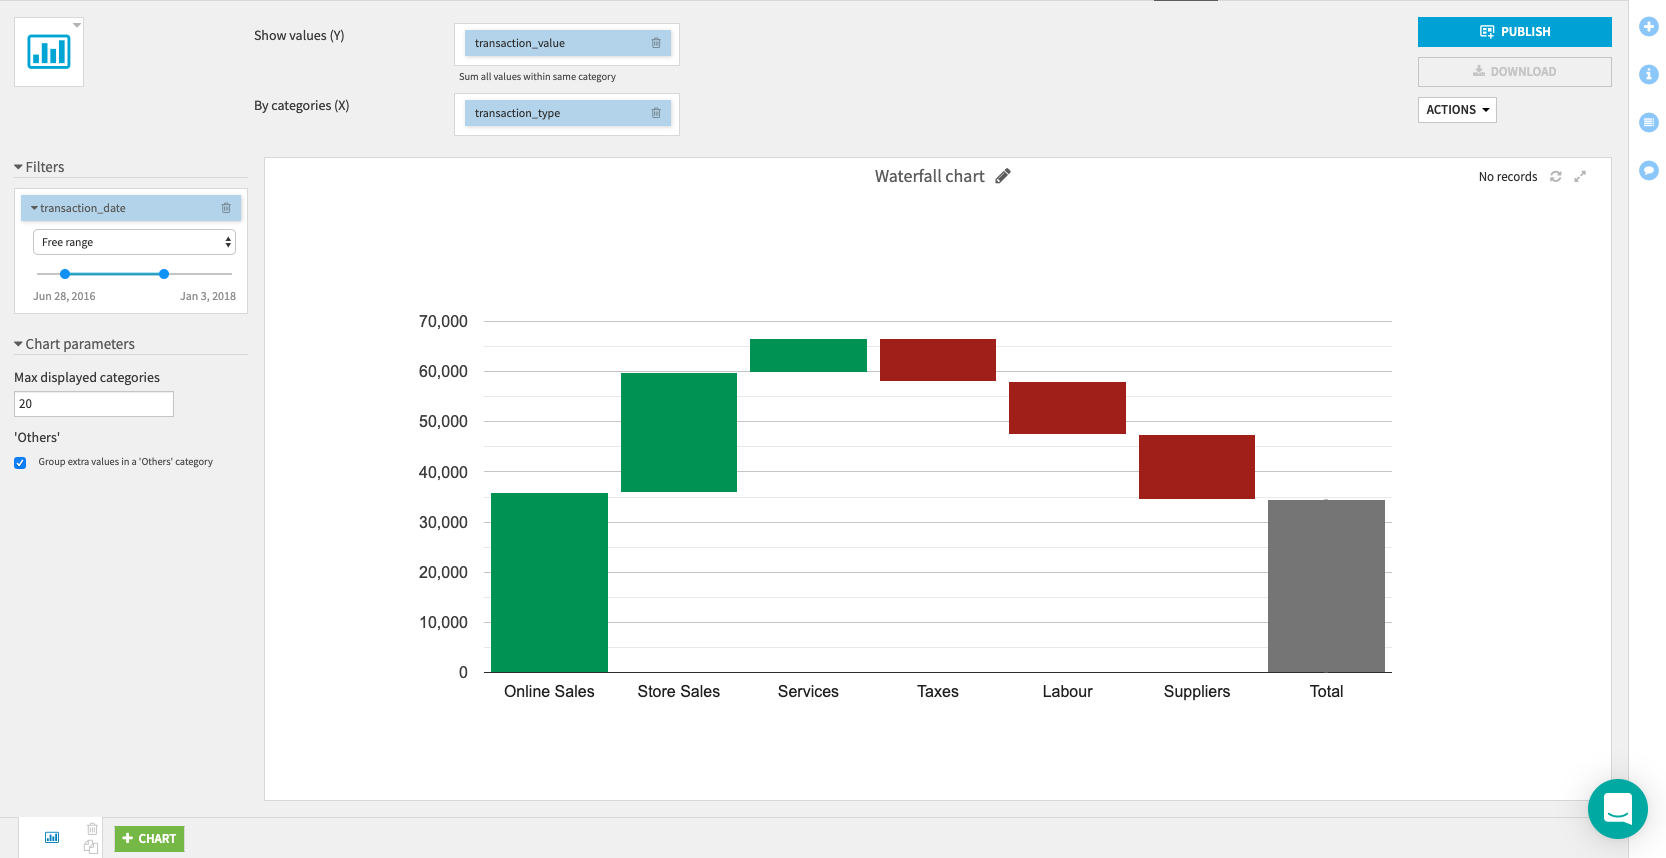
For each type of transactions, the total sum of its values is computed and then these categories are sorted in decreasing order.
The Total column corresponds to the total cumulative values of all categories.