Deliver trusted analytics
Move analysts off spreadsheets and legacy desktops without disruption. AI-assisted, governed pipelines preserve institutional knowledge and deliver trusted decisions at enterprise scale.

Foundations for trusted analytics at enterprise scale
AI-assisted data preparation, standardized by design
Manual data wrangling creates errors and inconsistency. Standardize data preparation from exploration to automated pipelines using AI assistance and approved business logic so inputs stay trusted at scale.
Eliminate manual data work
Prepare, join, clean, and enrich data 10x faster using AI-assisted tools, visual workflows, or code with every step documented, versioned, and governed.
Standardize data preparation across use cases
Reuse curated datasets and approved preparation steps to apply consistent business logic across use cases, eliminating rework and conflicting results.
Accuracy by default
Embed quality checks directly into pipelines and automate execution end to end, so analytics stay accurate, repeatable, and production-ready.
Build analytics leaders can trust at scale
If leaders don’t trust the numbers, they won’t trust the decisions. Build transparency and quality into analytics pipelines so results are reliable, explainable, and aligned across the enterprise.
Analytics safe to act on
Enable leaders to act on dashboards, models, and AI outputs without second-guessing data quality or reliability.
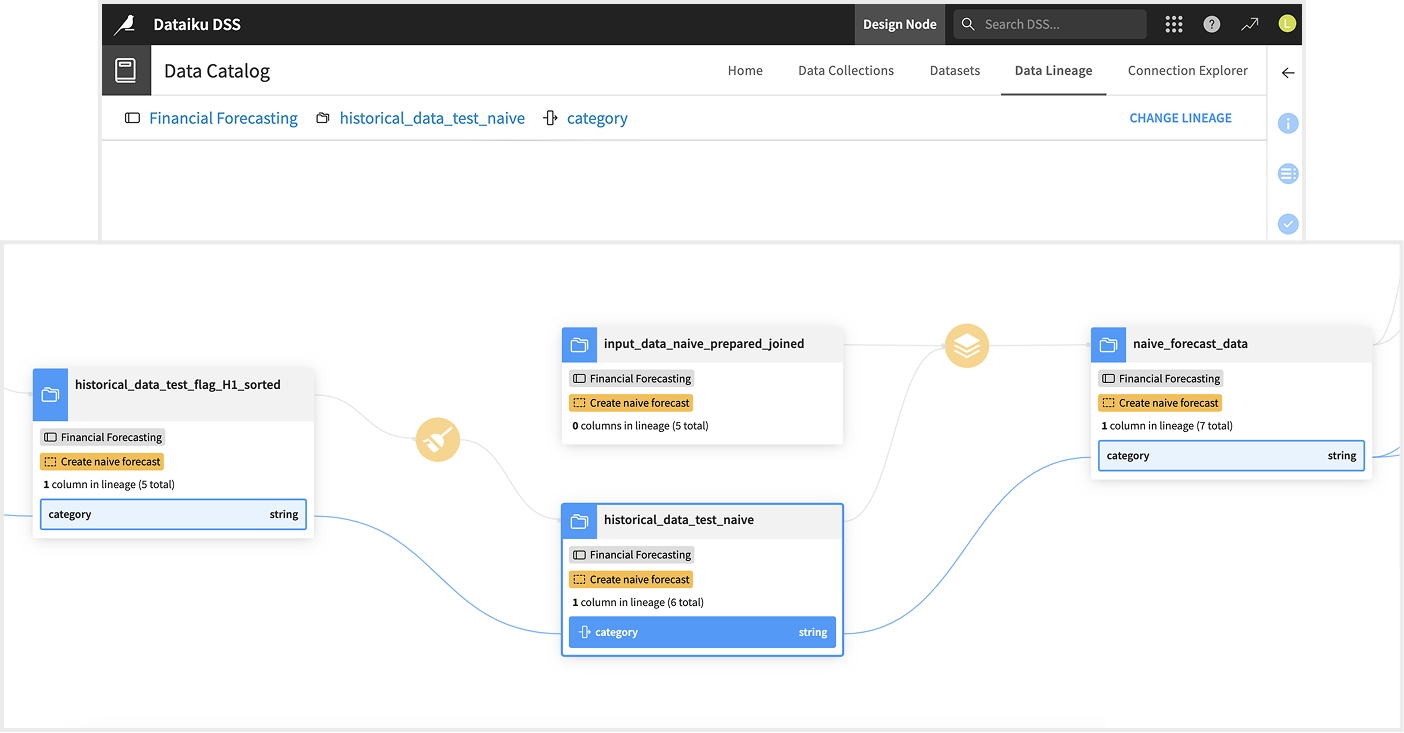
Explainable from source to insight
Provide end-to-end transparency from source to insight so analytics and AI outputs can be explained, defended, and audited.
One trusted answer
Standardize analytics on certified datasets and metrics, eliminating conflicting reports and restoring confidence in enterprise decision-making.
Control analytics cost and complexity
As analytics scales, fragmented tools increase cost and risk. Centralize analytics into one governed system so leaders retain visibility and control as usage grows.

"Manual data curation was replaced with automated workflows in Dataiku. This eliminated errors and reduced processing time from hours to minutes."
Andrew Symeou, Dataiku Alliance Manager, Deloitte
Eliminate shadow analytics
Replace disconnected spreadsheets and desktop tools with a single platform that gives leaders visibility and control across all analytics initiatives.
Predictable analytics costs
Lower integration, support, and maintenance costs by consolidating analytics, meeting enterprise needs without cost sprawl.
Control without bottlenecks
Apply consistent controls across analytics and AI initiatives while teams continue to move fast, no bottlenecks, no workarounds.
Frequently asked questions
Dataiku is a unified platform for analytics, dashboards, machine learning, and AI. It helps teams streamline workflows, reduce tool sprawl, and scale insights across the organization.
Dataiku Stories and generative AI assistants help analysts and business users turn data insights into narrative presentations that highlight trends, anomalies, and actionable recommendations.
Yes. Dataiku Apps and interactive dashboards empower non-technical users to explore, filter, and visualize data without writing code, while maintaining governance and consistency across the organization.
Dataiku provides drag-and-drop dashboard building, interactive charts, and integration with Dash, Bokeh, and Streamlit. Users can create automated dashboards, predictive reports, and GenAI-enhanced presentations from certified datasets and trusted workflows.
Dataiku connects to cloud data sources like Snowflake, BigQuery, Redshift, and S3, and runs on AWS, Azure, or GCP. It unifies analytics, AI, and governance, giving teams flexibility and control across cloud environments.
Dataiku unifies BI analytics, predictive modeling, machine learning, and generative AI in one governed environment. Teams collaborate using visual, low-code, or full-code workflows to accelerate insights and reduce duplication.
Dataiku offers end-to-end lineage, certified datasets, audit trails, and data quality rules to ensure analytics outputs are consistent, compliant, and auditable.