


Plugin Information
| Version | 2.2.1 |
|---|---|
| Author | Dataiku |
| Released | 2014/12/24 |
| Last updated | 2022/04/06 |
| License | Proprietary |
One of the challenges for successful Geospatial analytics with DSS is being able to aggregate from individual geolocalized data points to meaningful aggregates, like per-region revenue. This plugin provides tools to aggregate geopoints to administrative levels (country, region, city …) both for data processing and data visualisation.
This plugin provides two types of component:
- A visual preparation processor for reverse geocoding (extracting city name, country, etc. for each geopoint);
- Support for the ‘Administrative map’ charts (aggregated visualisation of geopoints on administrative levels)
Detailed documentation
How to set up
To get help on how to install a plugin, please refer to the following documentation.
How To Use
The plugin has two types of components:
- a Reverse Geocoding processor (in the Prepare visual recipe)
- Administrative maps
The plugin has been built based on the Open Street Map data.
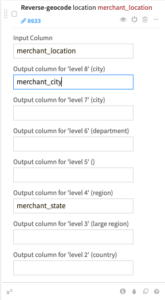
Reverse geocoding processor
The reverse geocoding processor takes geographic coordinates as input and extracts the different levels of administrative boundary to which it belongs (country, region, city …).
The input should be a GeoPoint or a Geometry column.
The processor will create two columns per administrative level for which you provide a column name: one with the local name of the administrative entity and one with the English name.
The administrative boundaries we use are the ones defined in Open Street Map. The type of administrative boundary for each level depends on the country. For more information about the administrative boundaries and the meaning of each level per country, please refer to the Open Street Map documentation.
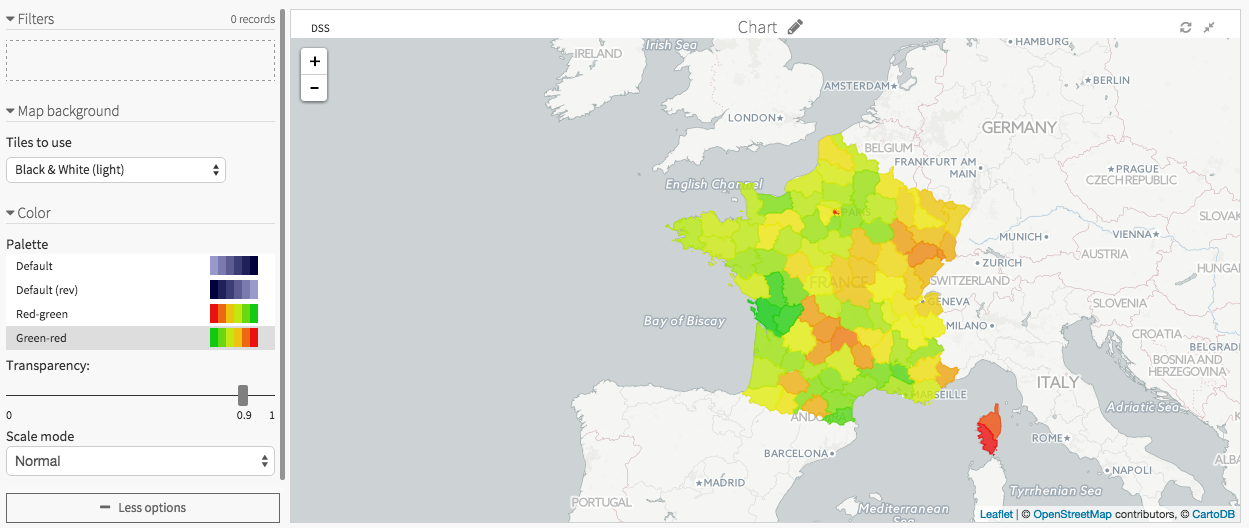
Administrative maps
This plugin is a pre-requisite for using Administrative maps.
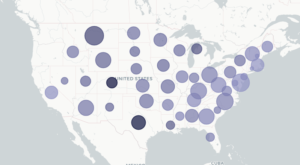
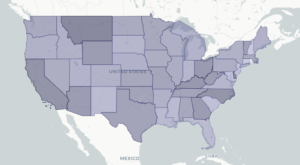
The Administrative maps display information from GeoGoints aggregated at an administrative level (either Country, Region/State, Department/County, Metropolis or City). There are two types of maps:
- Bubbles maps: the administrative entities on which data are aggregated are represented with bubbles
- Filled maps: the administrative entities on which data are aggregated are represented with their polygons
For more information, see our reference documentation.
Both the charts and the preparation processor operate on columns with Geometry or Geopoint meaning in DSS