


Flow
Look at the flow to retrace the different steps of data preparation (recipe icons in yellow) and machine learning (in green) that were needed to score each car. Check out the different input datasets to get familiar with our raw data.
EXPLORE !
A more advanced project using real world data for Predictive Maintenance can be discovered here.
I am data scientist at a large car-rental company. To make sure our clients don’t rent out cars that could break down, we replace the cars that we believe are likely to have technical problems regularly. But we don’t want to replace them too often either, to limit cost. Part of our business is optimising that balance.
I recently noticed that 3 months ago more of our cars had technical issues than usual. Last August, an unusual proportion of our cars had a problem with the transmission.
We had collected data about the cars that where affected by this problem of course, and how these cars had been used in the months before they broke.
As you can imagine, our goal was to identify the reasons for this problem and find out how to prevent it from happening again in the next months.
We gathered data to solve those two goals: – measures taken during the various failures (august) – data about how cars had been used in the weeks before their incidents (june & july) – information from the maintenance department (june & july)
We followed 4 steps to go from that raw data to achieving our business goals, and preventing the next failures:
Step 1: Explore and prepare the data: We made several transformations to the raw data so we could get valuable information from it. Typically, we transformed that data to create a new dataset aggregated at the car level, with as many relevant features as possible about each vehicle.
Step 2: Create the model: DSS trained a model to predict the feature we wanted to understand (failure or not failure), using the historical data we computed in the previous step.
Step 3: Apply the model to the new data: We deployed the model to have the probability that each car would have the same failure in the next few months
Step 4: Make a decision: Knowing the probability of failure, we identified two groups of cars : the cars we had to check in the 2 next days because they were most likely to have issues, and the cars that we could wait a few extra days to check.
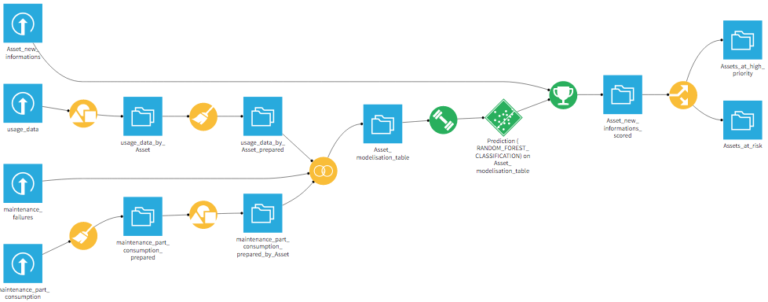
Look at the flow to retrace the different steps of data preparation (recipe icons in yellow) and machine learning (in green) that were needed to score each car. Check out the different input datasets to get familiar with our raw data.
EXPLORE !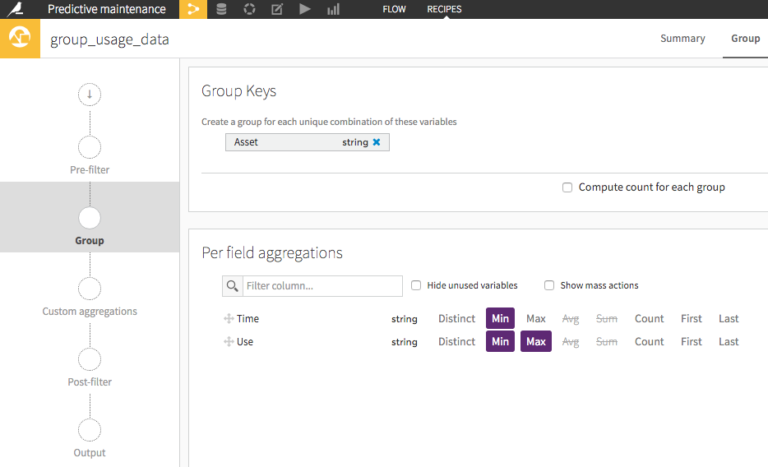
See how we build a group recipe to reformat our usage data, to aggregate data at the vehicle level (instead of our original log format).
EXPLORE!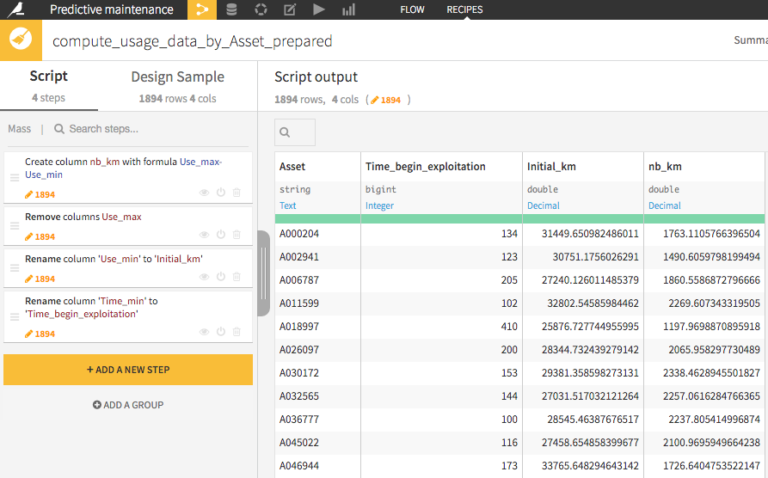
See the different steps of our data preparation script on that usage data, to create new features thanks to the visual editor.
EXPLORE!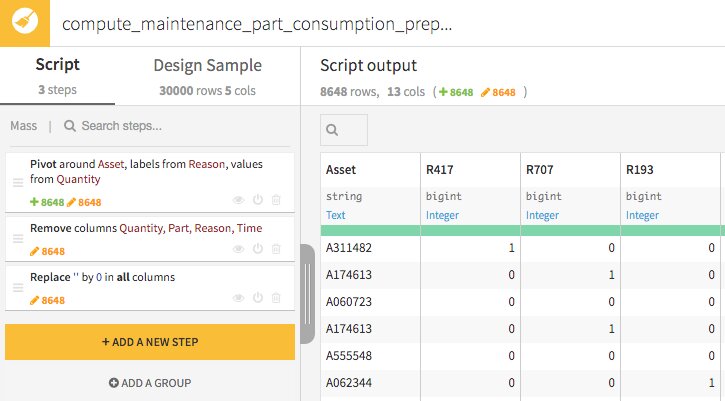
See the preparation of our maintenance consumption data, with a good example of how use the pivot function!
EXPLORE!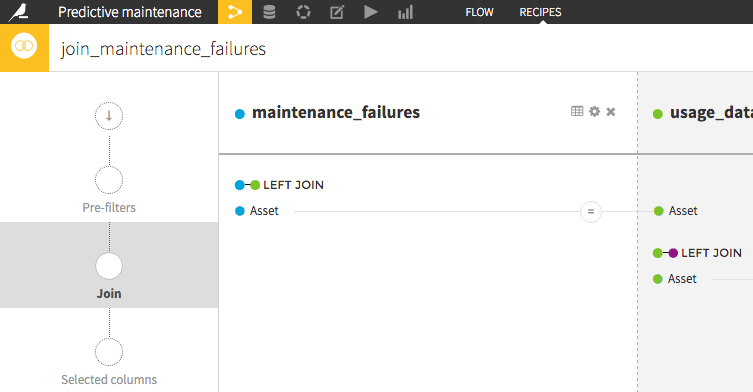
Now check out how we combine all of our data sources to get all of the information we created in a single dataset, thanks to a join recipe.
EXPLORE!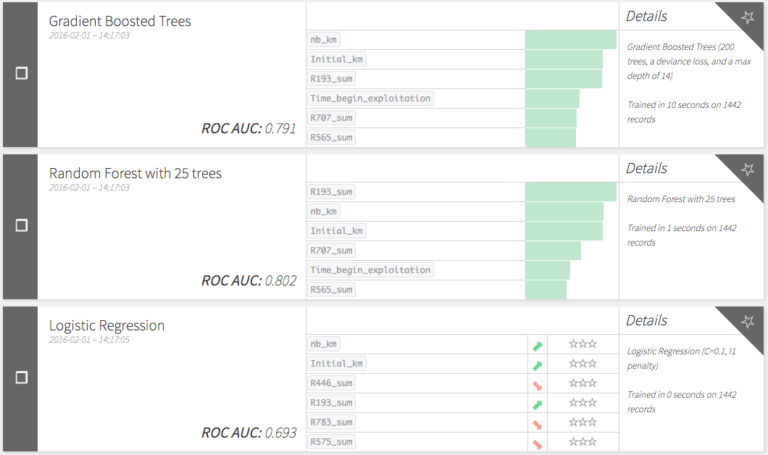
Machine learning, finally! DSS trained different types of models and compared their performance, so we could deploy our favorite one. All this, in just few clicks in the visual modelling interface.
EXPLORE!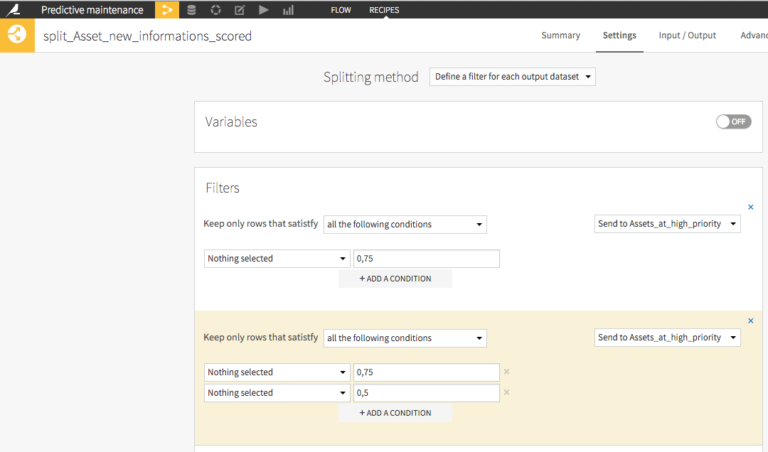
After we deployed our model on our new data, which created a new feature with our prediction, we made the result more practical by splitting the resulting dataset in the cars we needed to fix RIGHT NOW and the ones that could wait a little.
EXPLORE!