We built this project from a data science competition hosted by datascience.net.
Project Goal
The goal of the project is to model the energy consumption of various sites and predict consumption peaks. The original data is from more than 40 French consumer sites. The data in this project has been simplified and contains records for only 3 sites.
How We Do This
To build this project we have two different data sources you can have a look at:
- sites: this dataset contains information about the three consumer sites from which the data was collected
- data: this dataset contains energy-use records from the different sites. This dataset gives us energy-use records for every 10 minutes.
In that dataset you’ll find these features:
- DATE_LOCAL: date of the record
- ID01, ID18, ID31: for each site, a column valued 1 if the record is for that location; 0 if not
- consomation: energy consumption (in kW)
- temperature: temperature (in Celsius)
Explore This Sample Project
Dashboard
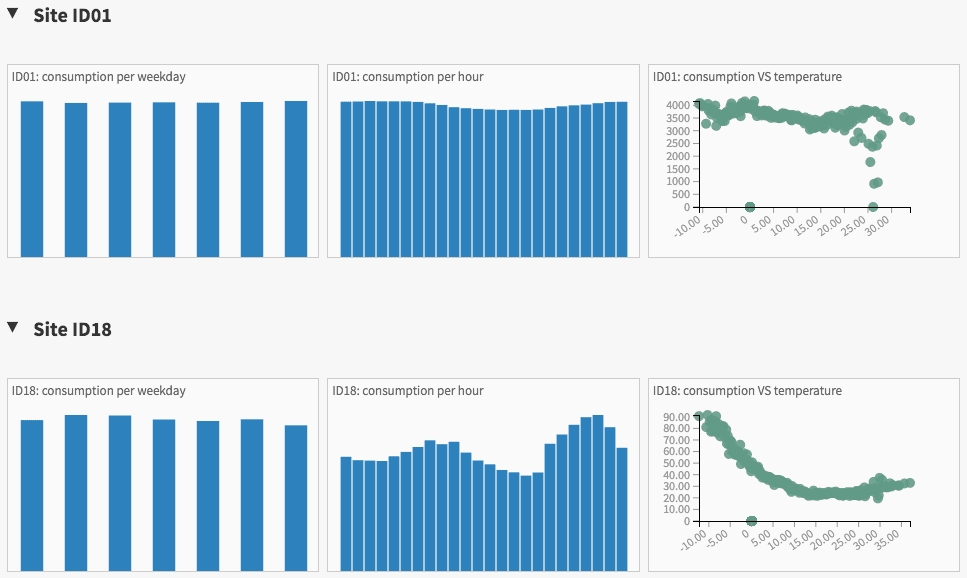
Start by taking a look at the charts we built on the dashboard. You can start seeing differences between the 3 sites :
- ID01 has a very high energy consumption, all the time, even during nights and weekends. It could be an industrial site that works 24/7.
- ID18 and ID31 seem to have a consumption peak at night.
- ID18 has a higher consumption when the temperature is low, ID31 has a higher consumption when the temperature is high.
EXPLORE !
Flow
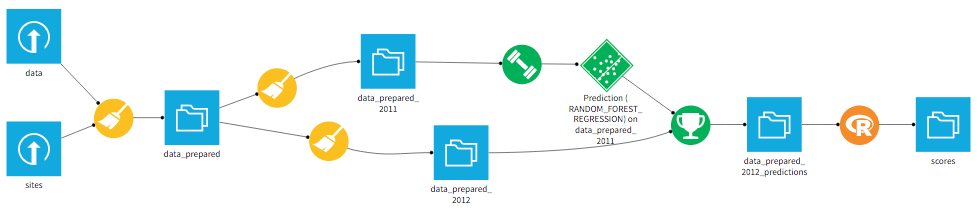
Have a look at the flow to understand how the site data is prepared, then modelized and scored.
EXPLORE!
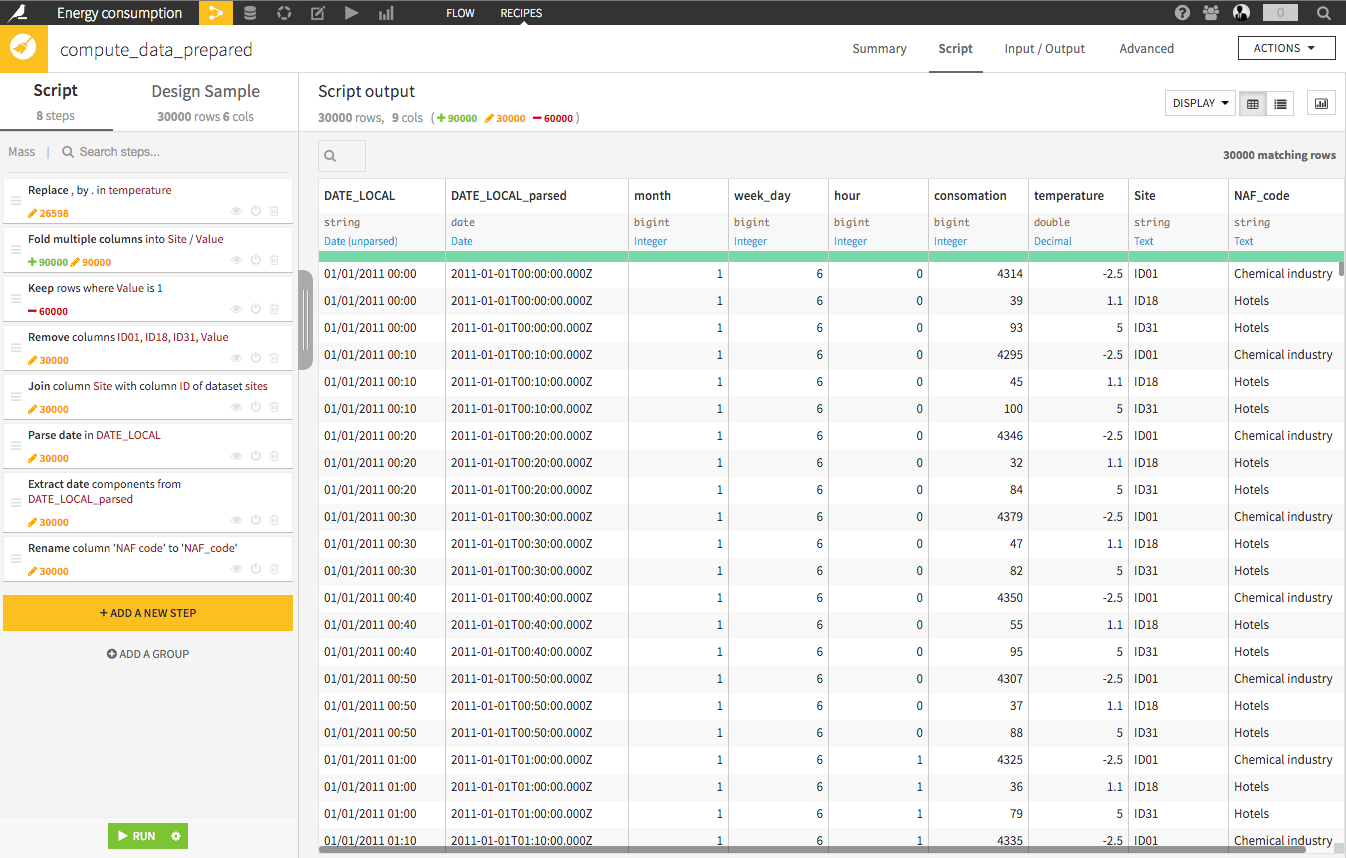
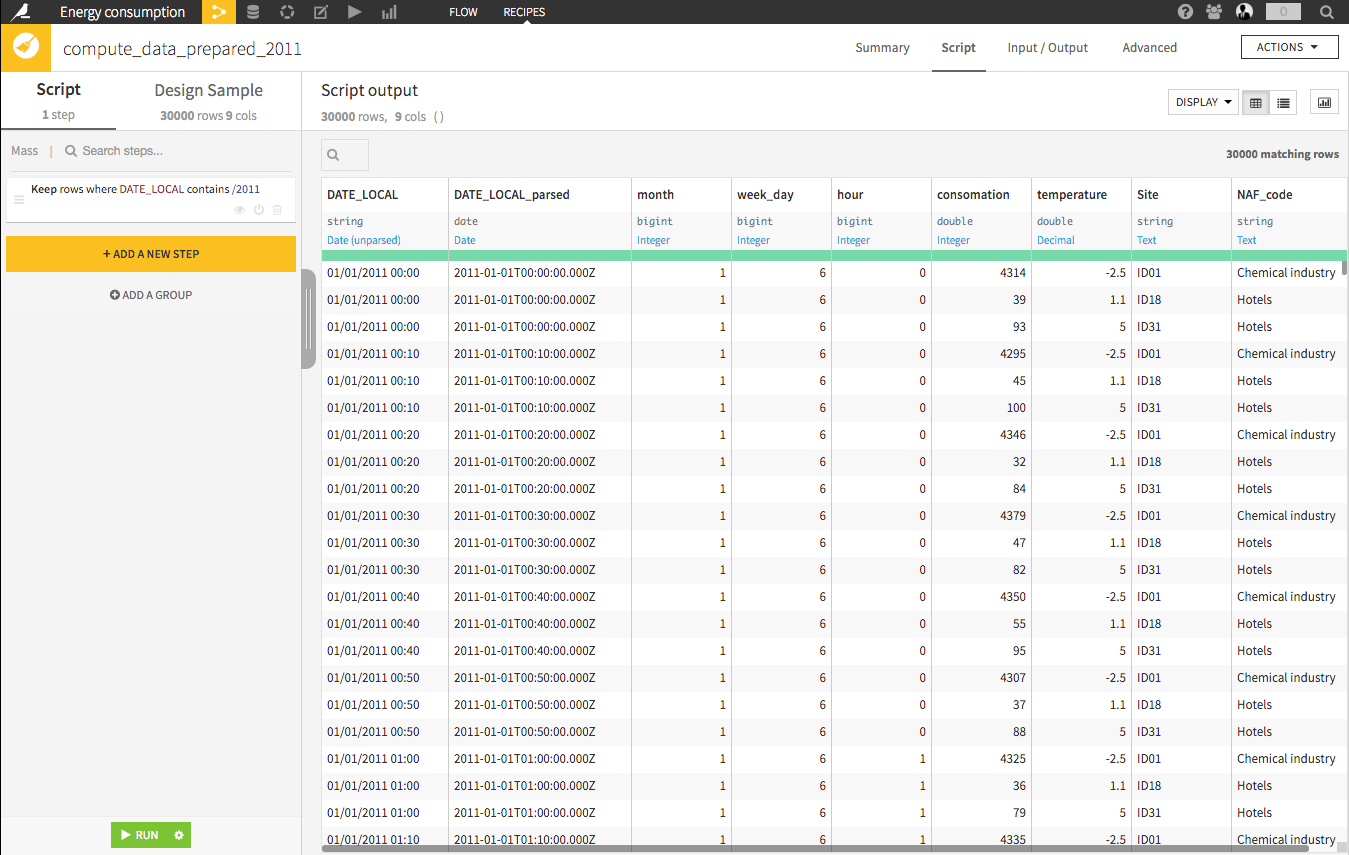
Data preparation 1
The first recipe combines the two datasets (LEFT JOIN) and clean some variables.
EXPLORE!
Data preparation 2
Then, the data is split into two datasets: records for the year 2011 and records for the year 2012. We do this because we want to train a model on historic data of 2011 and deploy it on the data from 2012 to make predictions.
EXPLORE!
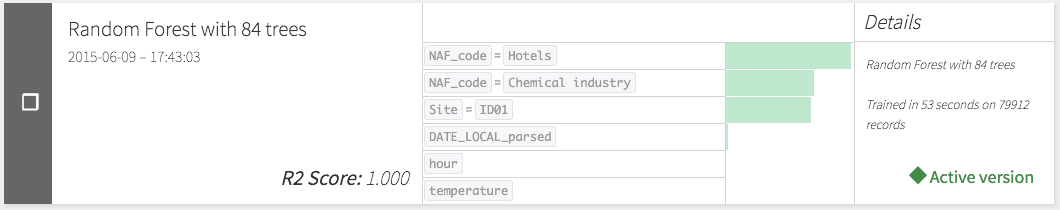
Model
A Random Forest algorithm is trained and used for the prediction.
EXPLORE!
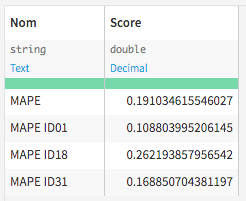
MAPE results
Then, an R recipe calculates the MAPE, (Mean Average Percentage Error) score globally and individually for each industries/locations. The model performs better for ID01. this could be expected since this ID has a consumption that is more consistent over time and temperature.
EXPLORE!