Newer Releases
There are 5 new releases of Dataiku 13:
- Dataiku 13.1 delivers Generative AI updates, additional XOps capabilities, governance enhancements, and visualization updates
- Dataiku 13.2 delivers updates to Generative AI, the LLM Mesh, Data Preparation, AI & Machine Learning enhancements, visualization updates, and more.
- Dataiku 13.3 delivers updates to Deploy Anywhere capabilities, testing frameworks, Generative AI features, visualization enhancements, and user experience improvements.
- Dataiku 13.4 delivers AI agents, multimodal knowledge banks, GenAI budget controls, and text-to-SQL capabilities.
- Dataiku 13.5 delivers accelerated GenAI innovation, strengthened governance, and enhanced accessibility for all users.
Highlighted updates
- AI/ML: Multimodal ML
- Universal Ops: Deploy and Monitor in Snowflake
- Universal Ops: Export models to Databricks registry
- Universal Ops: Data Status in Unified Monitoring
- Universal Ops: Data Quality Ruleset templates
- Generative AI: LLM Mesh additions
Explore many more feature updates organized by Dataiku capability below.
Generative AI
Generative AI capabilities in Dataiku
LLM Mesh Improvements
Changes to the LLM Mesh allow users to access the latest and most powerful LLM models from various providers through the LLM Mesh’s managed connections – while ensuring secure and governed access to LLM resources through centralized administration and monitoring.
Knowledge Banks boost efficiency and collaboration across projects.
The LLM Mesh improvements introduce support for new models, connections, and features, including:
- New Mistral AI connection to support the latest API-based model
- Databricks DBRX Instruct model available in the Mosaic AI connection
- Ability to specify the “Organization ID” to the OpenAI connection
- Ability to share Knowledge Banks between projects
- Vertex AI & Databricks LLMs can be augmented with Knowledge Banks (bugfix)
Prompt Studios UX Improvements
The Prompt Studios UX has received several enhancements aimed at improving usability and efficiency:
- Prompt list in left tray is now collapsed by default, saving screen space and making it easier to work with long prompts and multiple examples, especially on smaller screens.
- Input field has been revamped to clearly distinguish between manually written test cases and cases from data sets.
- The interface now clarifies when the displayed results are no longer related to the current prompt settings, ensuring better context when developing & evaluating prompts.
- Users can now preview test cases from their input data sets before running the query, allowing for a better understanding of what types of values will be sent to the LLM prior to running the request.
- A new button has been introduced to automatically set a test case as an example, eliminating the need to retype inputs into the example window manually.
These improvements streamline the workflow and enhance the overall user experience within the Prompt Studios.
AI/ML
Machine learning capabilities in Dataiku
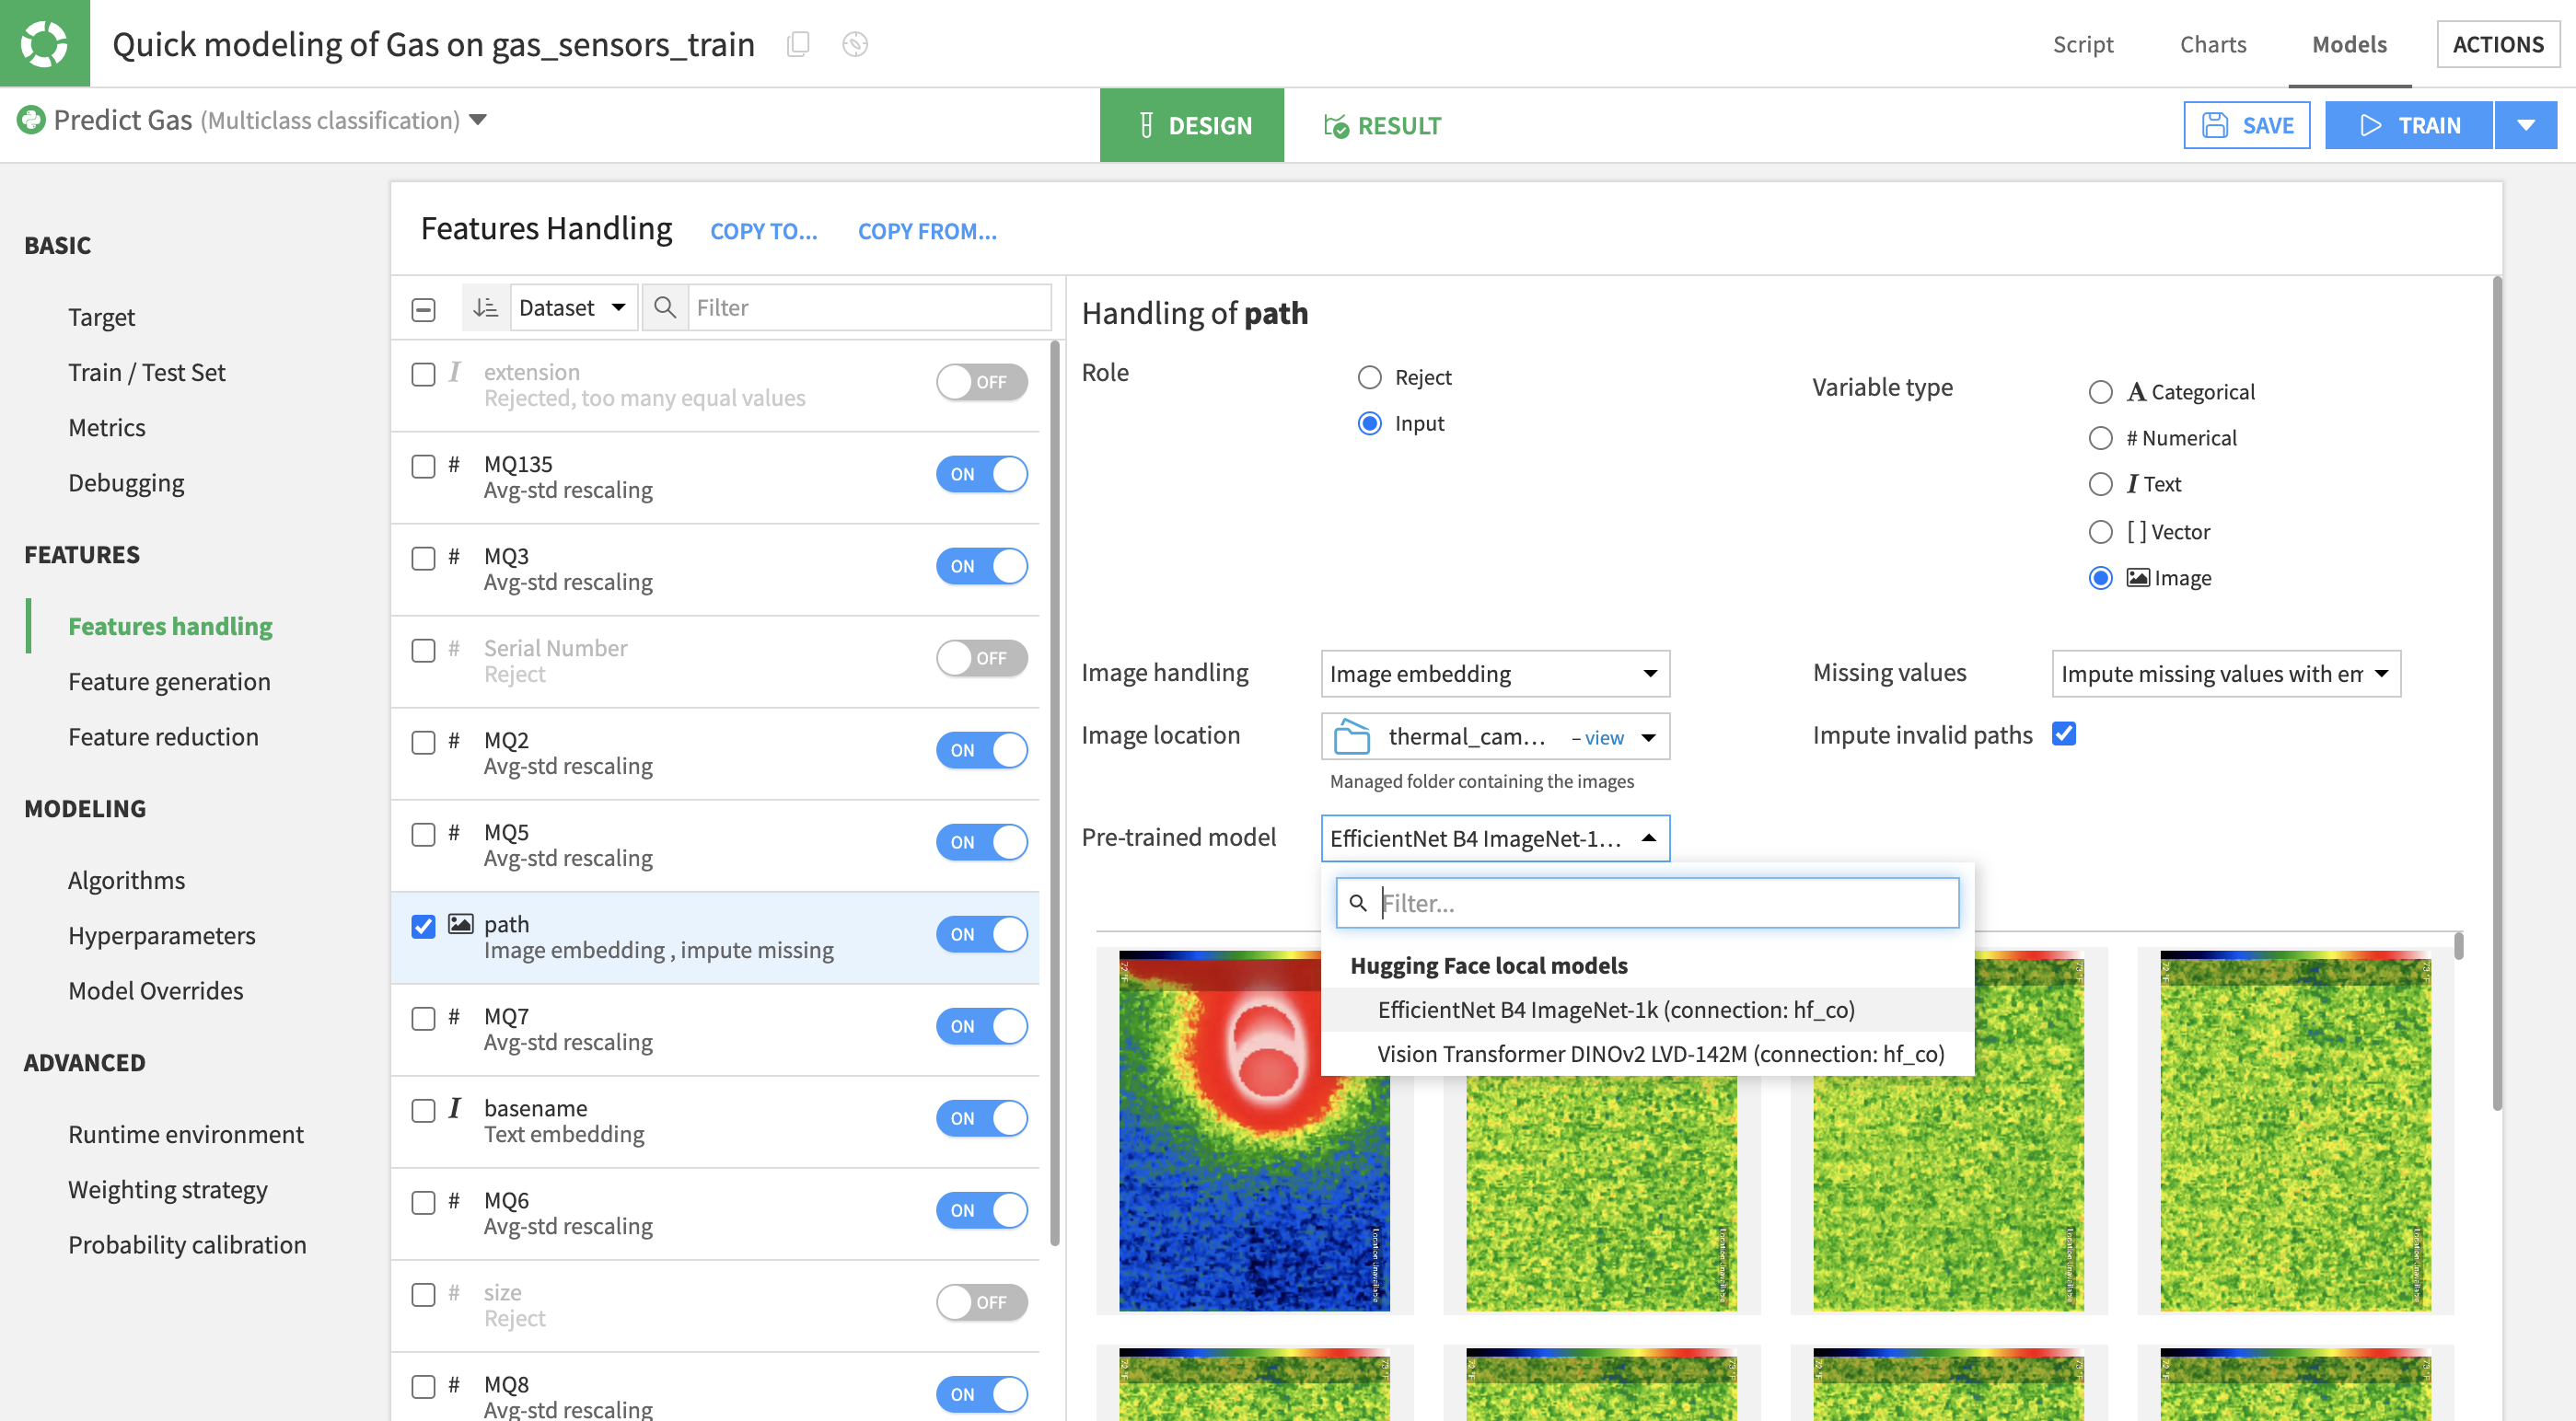
New feature: Multimodal ML
Multimodal ML enables Dataiku users to develop models in AutoML that incorporate images, text, and tabular data. By leveraging the most suitable feature extraction and embedding models from LLM Mesh connections for each modality, users can extract the most relevant information from their features. This allows users to leverage the most recent and relevant embedding or extraction models from connections in your LLM Mesh.
By using embedding models from LLM Mesh connections, administrators can ensure secure, governed, and resource-effective development of multimodal models, resulting in cost savings and efficient computational usage.
Universal Ops
DataOps capabilities and MLOps capabilities in Dataiku
Snowflake for Deploy Anywhere & Unified Monitoring
Unified Monitoring removes siloes between platforms used to develop and productionalize models by providing a single interface to monitor pipeline health and oversee models from diverse origins.
With the new Model deployment to Snowflake, users can now utilize Snowpark Container Services to deploy their models developed in Dataiku. This integration allows for automatic status updates on activity, deployment, execution, and model drift monitoring on all models deployed in Snowpark Container Services, providing visibility and governance through Dataiku’s Unified Monitoring.
Data Status in Unified Monitoring
This new status in the unified monitoring dashboard indicates the data health or quality of the projects and pipelines deployed in Dataiku.
By combining operational and data quality statuses in a unified dashboard, operators and admins can easily identify potential data quality issues at a glance that may impact downstream processes or analytical insights.
Data Quality Ruleset Templates
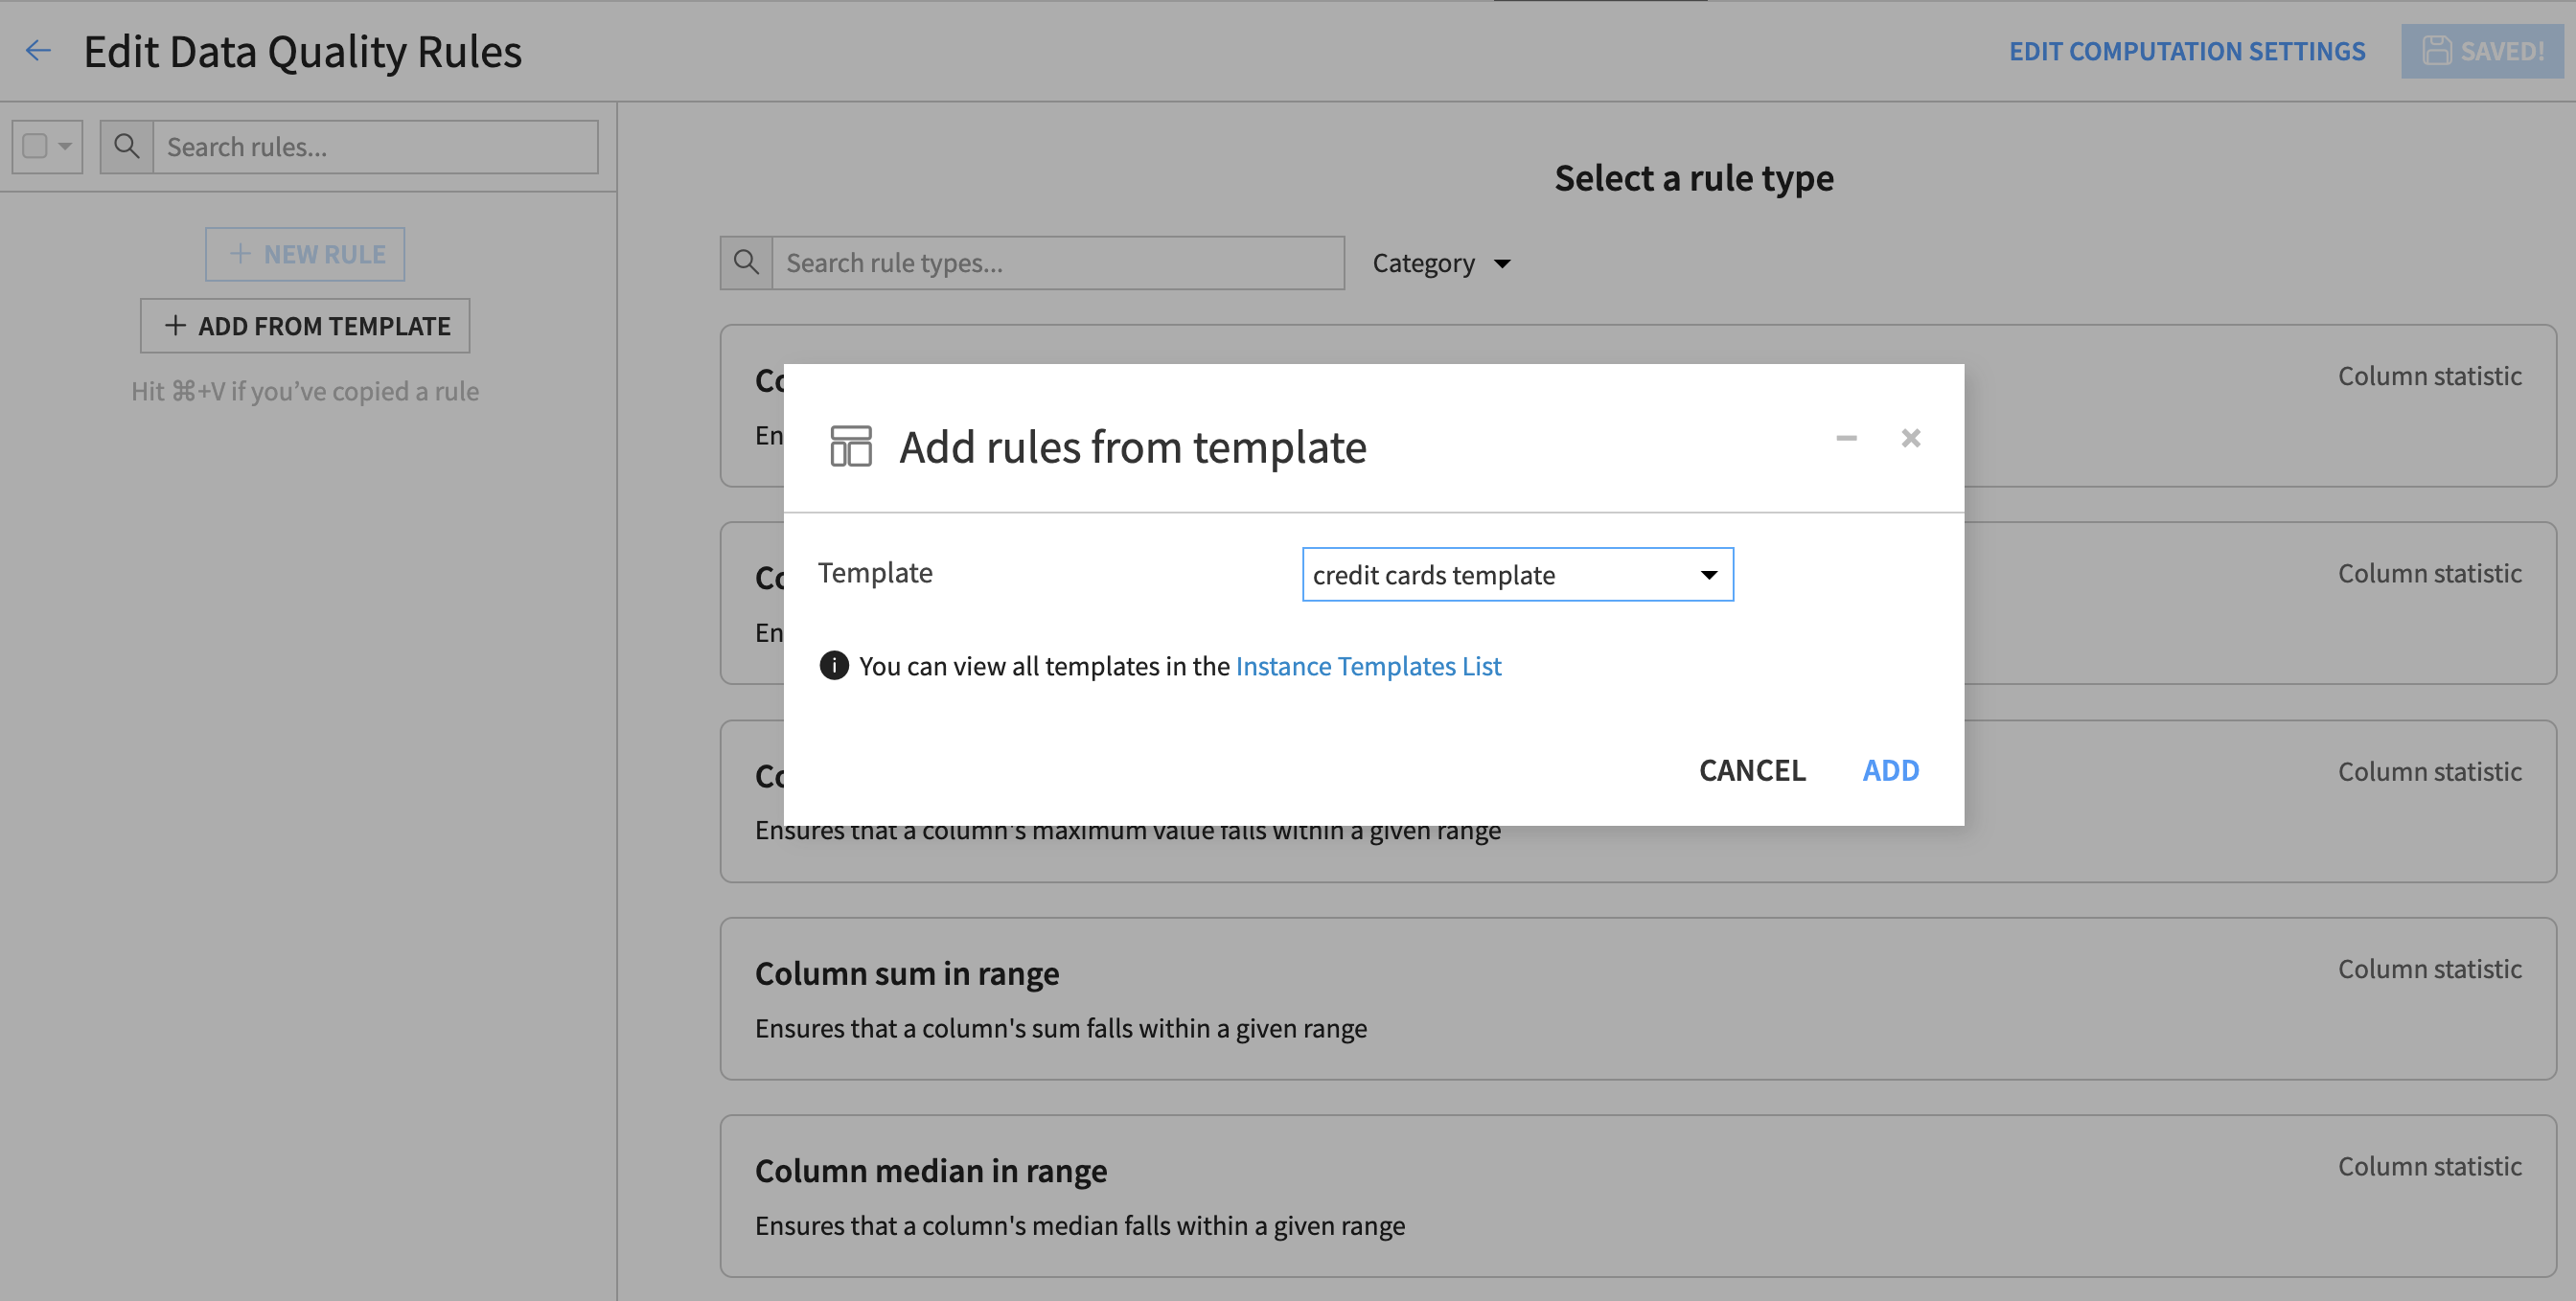
This allows the copying and reusing of the newly released data quality rules.
Data quality rule templates allow users to save a group of rules as a packaged template and import these templates when creating new rules. All templates are accessible from the centralized instance-level data quality page, enabling easy sharing and reusability across datasets and projects.
Model Evaluation: Text Columns in Drift Monitoring
Support for monitoring drift in text columns has been added to the drift monitoring section in the Model Evaluation Store. Text-based drift metrics are displayed in a dedicated section of the model evaluation, providing visibility into potential distribution shifts in textual features between the reference and current datasets. This acknowledges the increasing prevalence of text data and enables more comprehensive drift analysis beyond just numerical and categorical features.
Model Export: Export model to a Databricks Registry
We have added the ability to export models directly to the Databricks registry from within Dataiku. Behind the scenes, the selected Dataiku saved model version is exported to MLflow format and automatically registered to your Unity Catalog or Databricks legacy registry, all within one seamless action. This feature is also available programmatically through the Dataiku Python API.
Visualization & Data Storytelling
Visualization capabilities in Dataiku
Publish a Model Evaluation Store to a Dashboard
Users can now publish their Model Evaluation Store (MES) directly to dashboards. This capability enables simple dashboarding for model monitoring by adding tabs from an MES to display the latest model evaluation results, including drift analysis, performance metrics, and other relevant insights. By consolidating this information in a centralized dashboard, teams can gain a higher-level, project-wide view of model monitoring and evaluation, facilitating better collaboration, documentation, and transparency across the organization. Furthermore, one or more MESs can be published to a workspace through these dashboards, providing a comprehensive MLOps view for a business initiative.
Charts Enhancements
Charts have received the following enhancements:
- Enable MIN/MAX aggregations for date columns for measures in 2 charts (KPI and pivot table), tooltips, and custom aggregations
- Scatter chart “connect the dots” to display the evolution of a numeric variable over time, with data points connected by straight line segments
- New zoom-by-rectangle selection and general performance improvements
- Chart gridlines
- Ability to change the default for empty values in pivot tables (0 for numeric, N/A for categorical)
Governance
Governance capabilities in Dataiku
Dataiku Govern Improvements
Dataiku Govern has received the following enhancements:
- Role assignment will be available at the item level.
- Inheritance rules and permissions are not editable
- The roles and permissions tab is new in the left navigation menu.
- (Advanced Govern) Blueprint Designer now has conditional views, making the workflow content dynamic by displaying/hiding specific views depending on other fields’ selected values.
Resources to Support Dataiku Users
New resources available to Dataiku users:
- EU AI Act Readiness Program: to triage AI use cases by risk level and enforce step-by-step workflows that align with the new EU Act’s rigorous requirements
- Dataiku User Network Program: a program to send relevant content, event invitations, product updates and tips to Dataiku users
- Dataiku Launch Program: A series to support new users onboarding to Dataiku to understand the basics of creating a project, working in a dataset, automating, and collaborating in Dataiku
- Public Alteryx Quick Start: Alteryx users interested in transitioning to Dataiku can follow this Quick Start to get up & running in <30 minutes! It assumes no prior knowledge of Dataiku; users only need an internet connection.
- Unified Google Search (on Community, Academy, Knowledge Base, Developer Guide & Dataiku.com): Users can easily search across various Dataiku domains & receive consolidated results, making it easier to find solutions.
- Import Serialized Pipelines: Users can follow a new tutorial displaying how to save a model trained using code into a native Dataiku object for MLOps & model management.
Find all details in our release notes.
