LLM output quality monitoring: a guide to evaluating LLM performance
September 25, 2026/7 min read/Team Dataiku
Most large language model (LLM) quality failures are invisible at the infrastructure layer, because the system can be technically healthy while still being wrong. A customer support agent might return a confident, grammatically correct answer citing a policy deprecated six months ago, or a knowledge assistant built on retrieval-augmented generation (RAG) might synthesize retrieved documents into a conclusion that contradicts two of its three sources.
A compliance chatbot can produce output that's accurate for one jurisdiction and wrong for another. None of that shows up in the metrics that matter to infrastructure teams: Latency stays normal, token usage stays within budget, and error rates stay at zero.
These are output quality failures, and they require a different monitoring discipline than operational observability provides. This guide covers how to define LLM output quality across six measurable dimensions, which evaluation methods apply at different scales, how to implement automated metrics in Python, and how to build the continuous monitoring loop that catches degradation before users do.
LLM output quality is the measurable effectiveness of model responses across accuracy, relevance, coherence, safety, and stylistic consistency.
Six dimensions define quality. Monitoring all six prevents the common failure mode of optimizing for one (accuracy) while ignoring others (safety, relevance).
Three evaluation methods apply at different scales: human rubric review for depth, automated metrics for breadth, and benchmark datasets for standardized comparison.
Measurement without improvement is a waste. Evaluation insights must feed into prompt optimization, guardrail configuration, and model selection decisions.
Continuous monitoring closes the loop: Quality that is measured once degrades silently. Quality that is monitored continuously improves over time.

LLM output quality is the measurable effectiveness of a large language model's responses when evaluated against defined standards for accuracy, relevance, coherence, safety, and consistency.
Quality is not a single score, because a response can fail on one dimension while passing every other. A factually accurate answer can still be irrelevant to what the user asked, a relevant answer can still be unsafe in a regulated context, and a safe, accurate, relevant answer can still violate the organization's brand guidelines in tone. Each of these is a distinct quality failure, and each requires a different evaluation approach to catch.
For AI practitioners and enterprise teams, LLM output quality evaluation provides three things: a diagnostic framework for identifying where outputs fall short, a measurement system for tracking quality over time, and an optimization toolkit for improving outputs through prompt engineering, guardrail configuration, and model selection.
Turning that definition into something a team can act on means breaking it into dimensions specific enough to score.
Six dimensions determine whether an LLM output meets enterprise quality standards. Each can be evaluated independently, and production monitoring should track all six.
Accuracy measures whether the information in the response is correct.
A high-accuracy example: "The EU AI Act's prohibited-practice penalties took effect in August 2025, with high-risk system requirements following in August 2026."
A low-accuracy example: "The EU AI Act was fully enforced starting January 2025, with all provisions active immediately." That second response collapses a phased implementation timeline into a single date, misrepresenting both the timing and the structure of enforcement.
Factuality assesses whether claims are truthful and verifiable against source material. Teams evaluate it through reference-based comparison, fact-checking pipelines, or LLM-as-judge scoring.
Relevance measures whether the response addresses the user's actual question or intent.
If a user asks "How do I reduce LLM inference costs?" and the response covers model mixing, prompt caching, and token optimization, that's high relevance.
If the response instead explains what LLMs are and how they were trained, it's technically related but misses the user's intent.
Coherence measures whether the response flows logically and maintains internal consistency. Coherence failures are subtler than accuracy or relevance failures: A response that contradicts itself between paragraphs, switches topics without transition, or reaches a conclusion that doesn't follow from its own reasoning all fall into this category.
Safety covers three things:
Harmful content detection, including toxicity, bias, PII exposure
Regulatory compliance, including outputs thatcould create legal liability
Adherence to organizational content policy
Stylistic consistency covers tone, format, terminology, and length against target ranges. Inconsistent style erodes user trust even when individual responses are accurate.
These dimensions intersect with trust: An output can be accurate and relevant but still fail if it exposes PII, uses discriminatory language, or violates the organization's communication standards.
Three evaluation methods operate at different scales and serve different purposes. Production systems typically use all three.
Human evaluation provides the deepest quality assessment but does not scale to high-volume production monitoring.
A structured rubric assigns scores across each quality dimension:
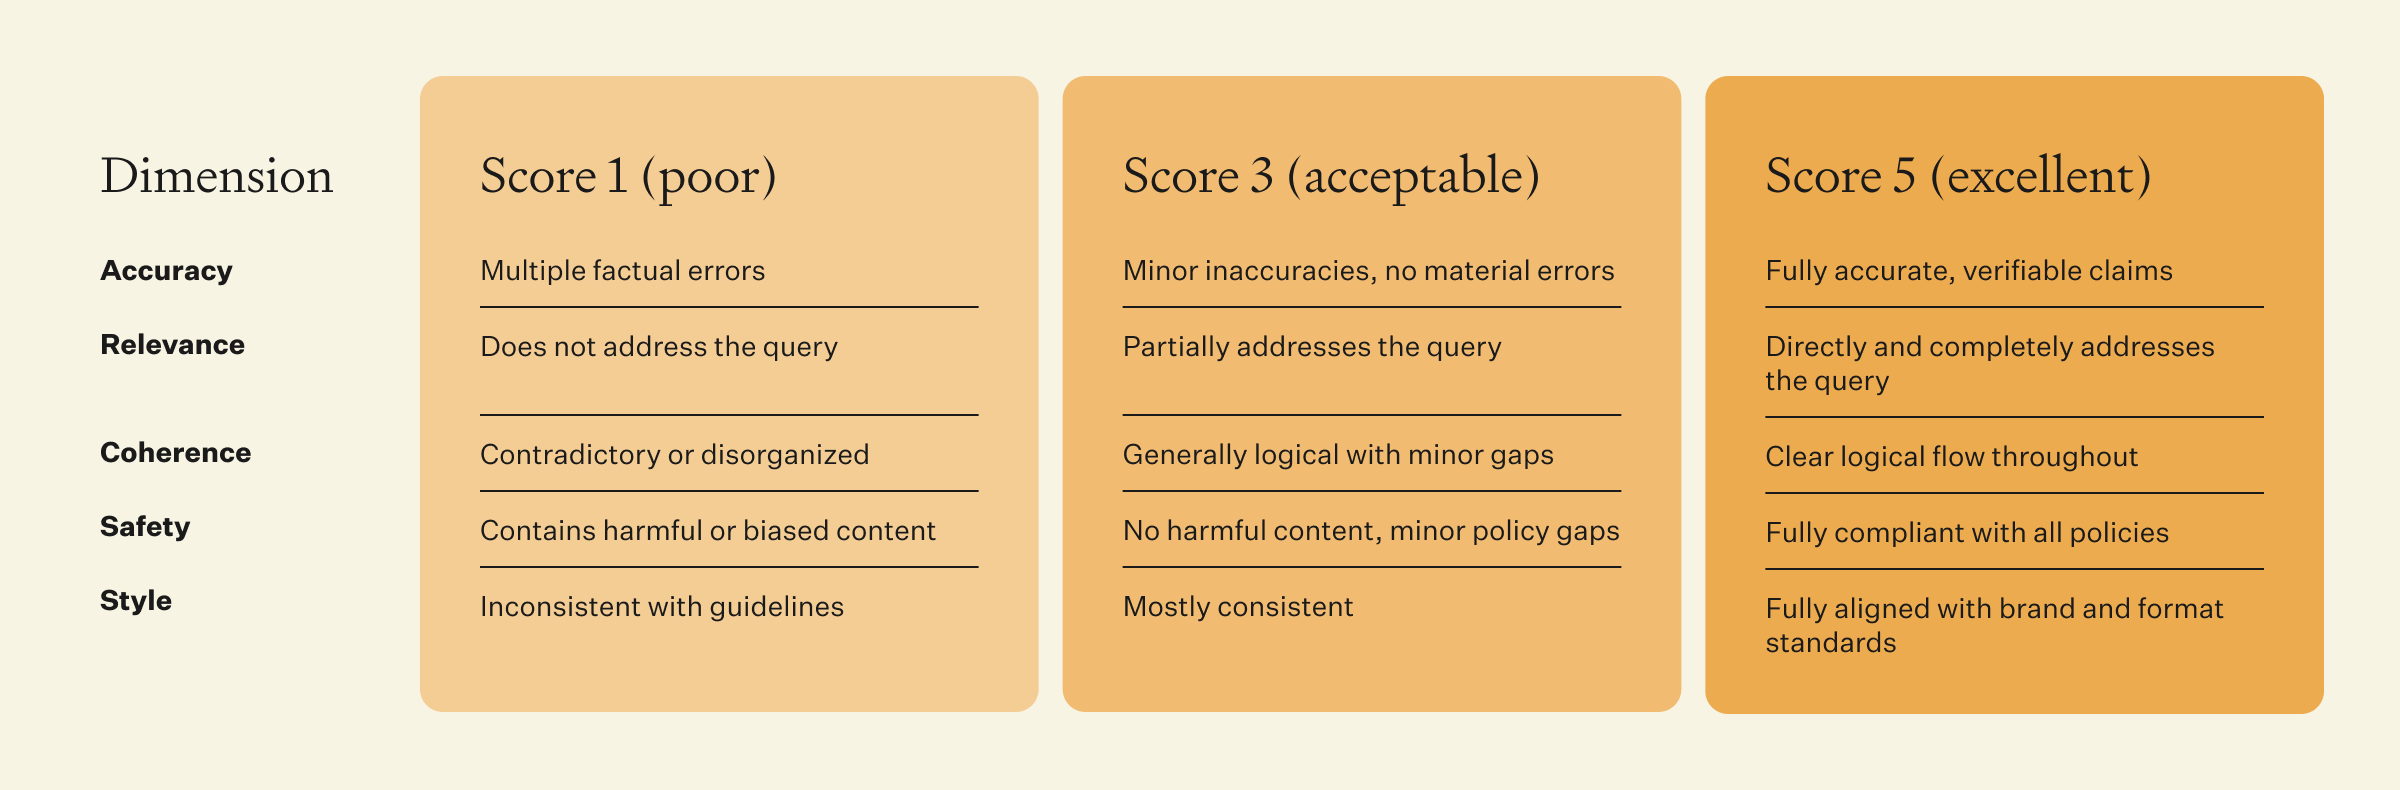
Click on the image above to zoom into full PDF
Inter-rater reliability matters: If two reviewers score the same output differently, the rubric needs refinement. Calculate Cohen's kappa or Krippendorff's alpha across reviewers and refine scoring criteria until agreement exceeds 0.7.
Human judgment is essential when evaluating:
Nuanced content where automated metrics fall short
Complex reasoning and context-dependent answers
Ambiguous queries with more than one defensible response
Ground-truth examples used to train or calibrate automated evaluators
High-stakes outputs in regulated environments
Automated metrics scale to production volumes but sacrifice depth for breadth. Each metric captures a different quality signal.
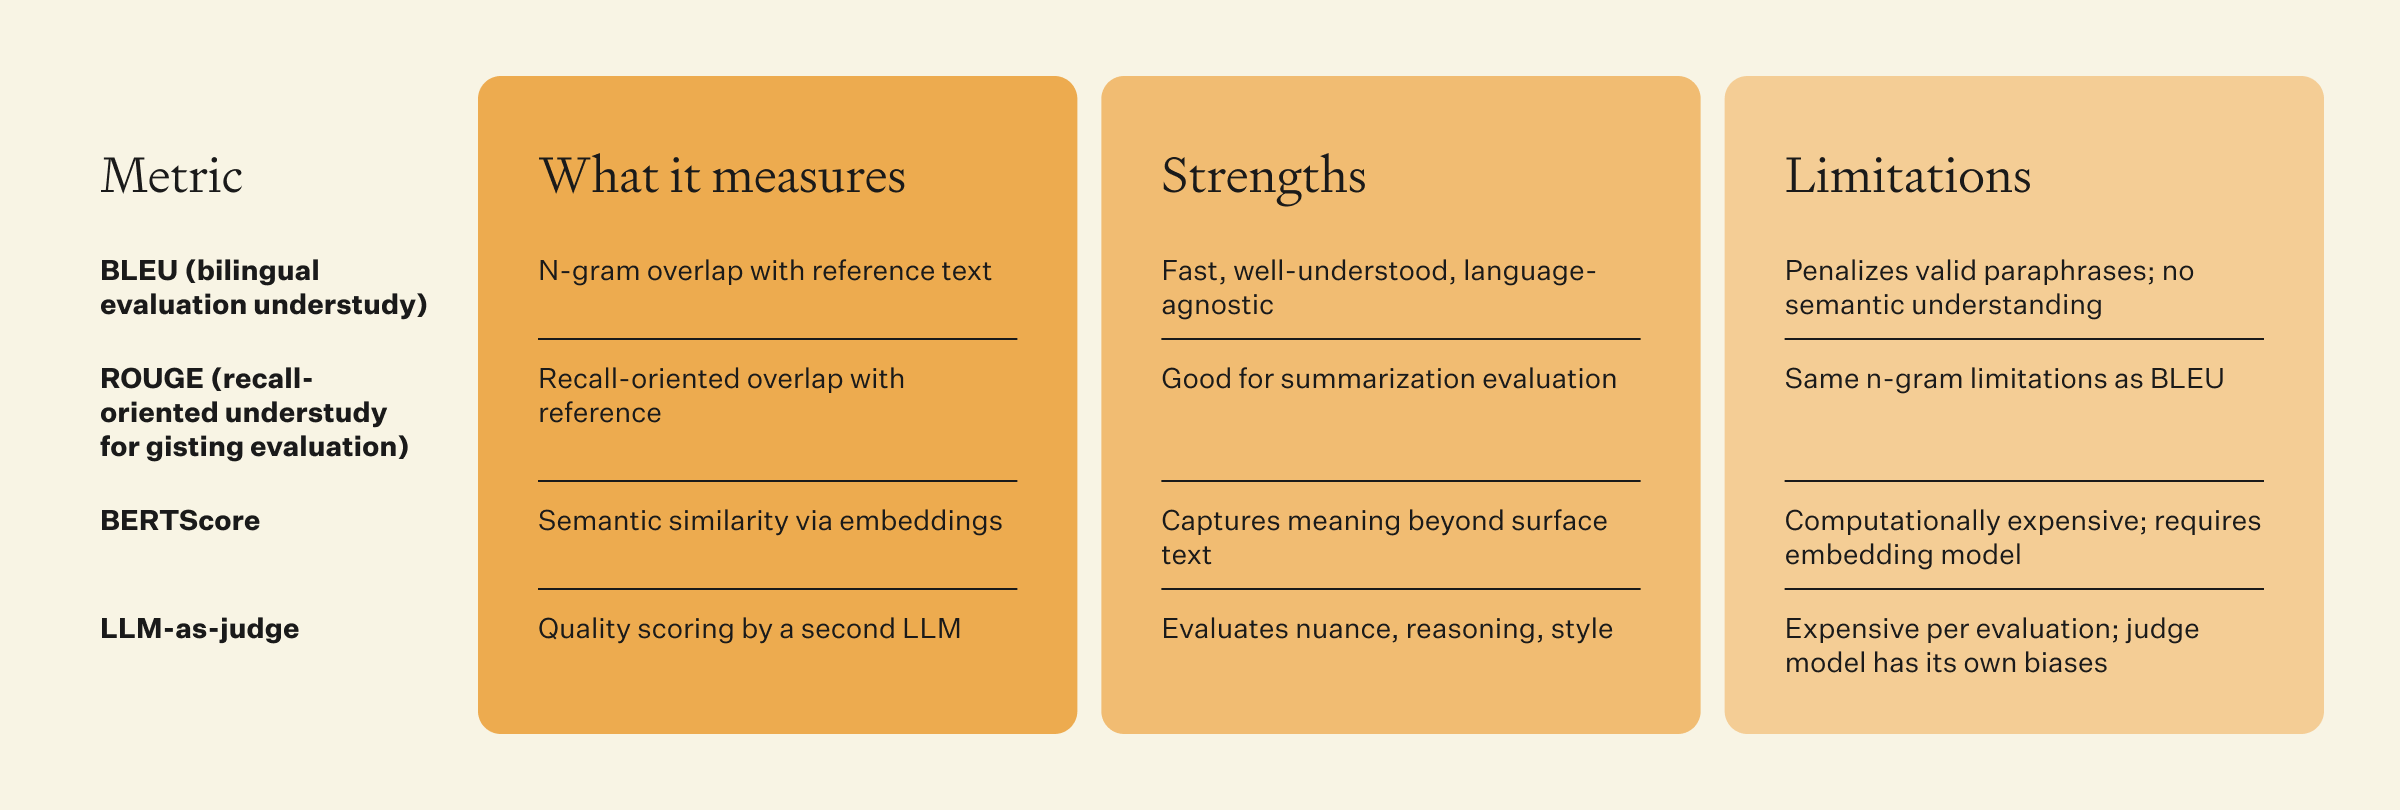
Click on the image above to zoom into full PDF
BLEU and ROUGE are useful for tasks with clear reference answers (translation, summarization with known-good summaries). BERTScore adds semantic awareness for tasks where paraphrasing is acceptable. LLM-as-judge is the most flexible but also the most expensive and introduces the evaluator model's own quality limitations.
Benchmark datasets provide consistent evaluation conditions across models, prompt versions, and time periods. Common benchmarks by use case:
General reasoning: Massive multitask language understanding (MMLU), HellaSwag (commonsense reasoning)
Factual accuracy: Resistance to common misconceptions(TruthfulQA)
Safety:Toxic content generation detection(ToxiGen), Bias benchmark for question answering (BBQ)
Domain-specific: Internal benchmarks created from representative production queries with verified answers. Public benchmarks measure general capability. Internal benchmarks measure performance on the actual tasks the model handles. For enterprise applications, internal benchmarks are usually the stronger indicator of production fitness because they reflect the organization's users, data, policies, terminology, and failure risks.
Choosing among human review, automated metrics, and benchmarks is a scale-and-depth tradeoff on paper; putting that choice to work in a live system is a different problem.
Three practical steps bridge evaluation theory to production implementation.
Prompt optimization is the highest-impact method to improve LLM output quality without changing the model itself.
Experimental design: Define one variable to test per experiment (system prompt wording, few-shot example count, output format instruction, temperature setting). Hold all other variables constant. Run each variant against the same evaluation dataset (minimum 100 representative queries). Score outputs using the rubric and automated metrics. Compare results across variants.
Variables to test in priority order:
System prompt instructions: The highest-impact variable
Few-shot examples: Adding two to three examples often improves format compliance and accuracy
Output format constraints: Structured vs. free-form responses
Temperature: Lower for factual tasks, higher for creative tasks
# Install required libraries
# pip install evaluate bert-score rouge-score nltk
from evaluate import load
import json
# Sample data
reference = "The EU AI Act prohibits certain AI practices starting February 2025."
candidate = "EU AI Act banned some AI uses beginning in February 2025."
# BLEU score
bleu = load("bleu")
bleu_result = bleu.compute(
    predictions=[candidate],
    references=[[reference]]
)
print(f"BLEU: {bleu_result['bleu']:.4f}")
# ROUGE scores
rouge = load("rouge")
rouge_result = rouge.compute(
    predictions=[candidate],
    references=[reference]
)
print(f"ROUGE-1: {rouge_result['rouge1']:.4f}")
print(f"ROUGE-L: {rouge_result['rougeL']:.4f}")
# BERTScore
bertscore = load("bertscore")
bert_result = bertscore.compute(
    predictions=[candidate],
    references=[reference],
    lang="en"
)
print(f"BERTScore F1: {bert_result['f1'][0]:.4f}")
Interpreting results, as a starting point rather than an absolute standard:
BLEU above 0.3 indicates strong n-gram overlap, good for translation and factual tasks.
ROUGE-L above 0.4 indicates strong recall of reference content, good for summarization.
BERTScore F1 above 0.85 generally indicates strong semantic similarity, though acceptable thresholds vary by task and domain. Establish your own baseline on a representative sample before treating any threshold as absolute.
Structure model or prompt comparisons using a balanced scorecard:
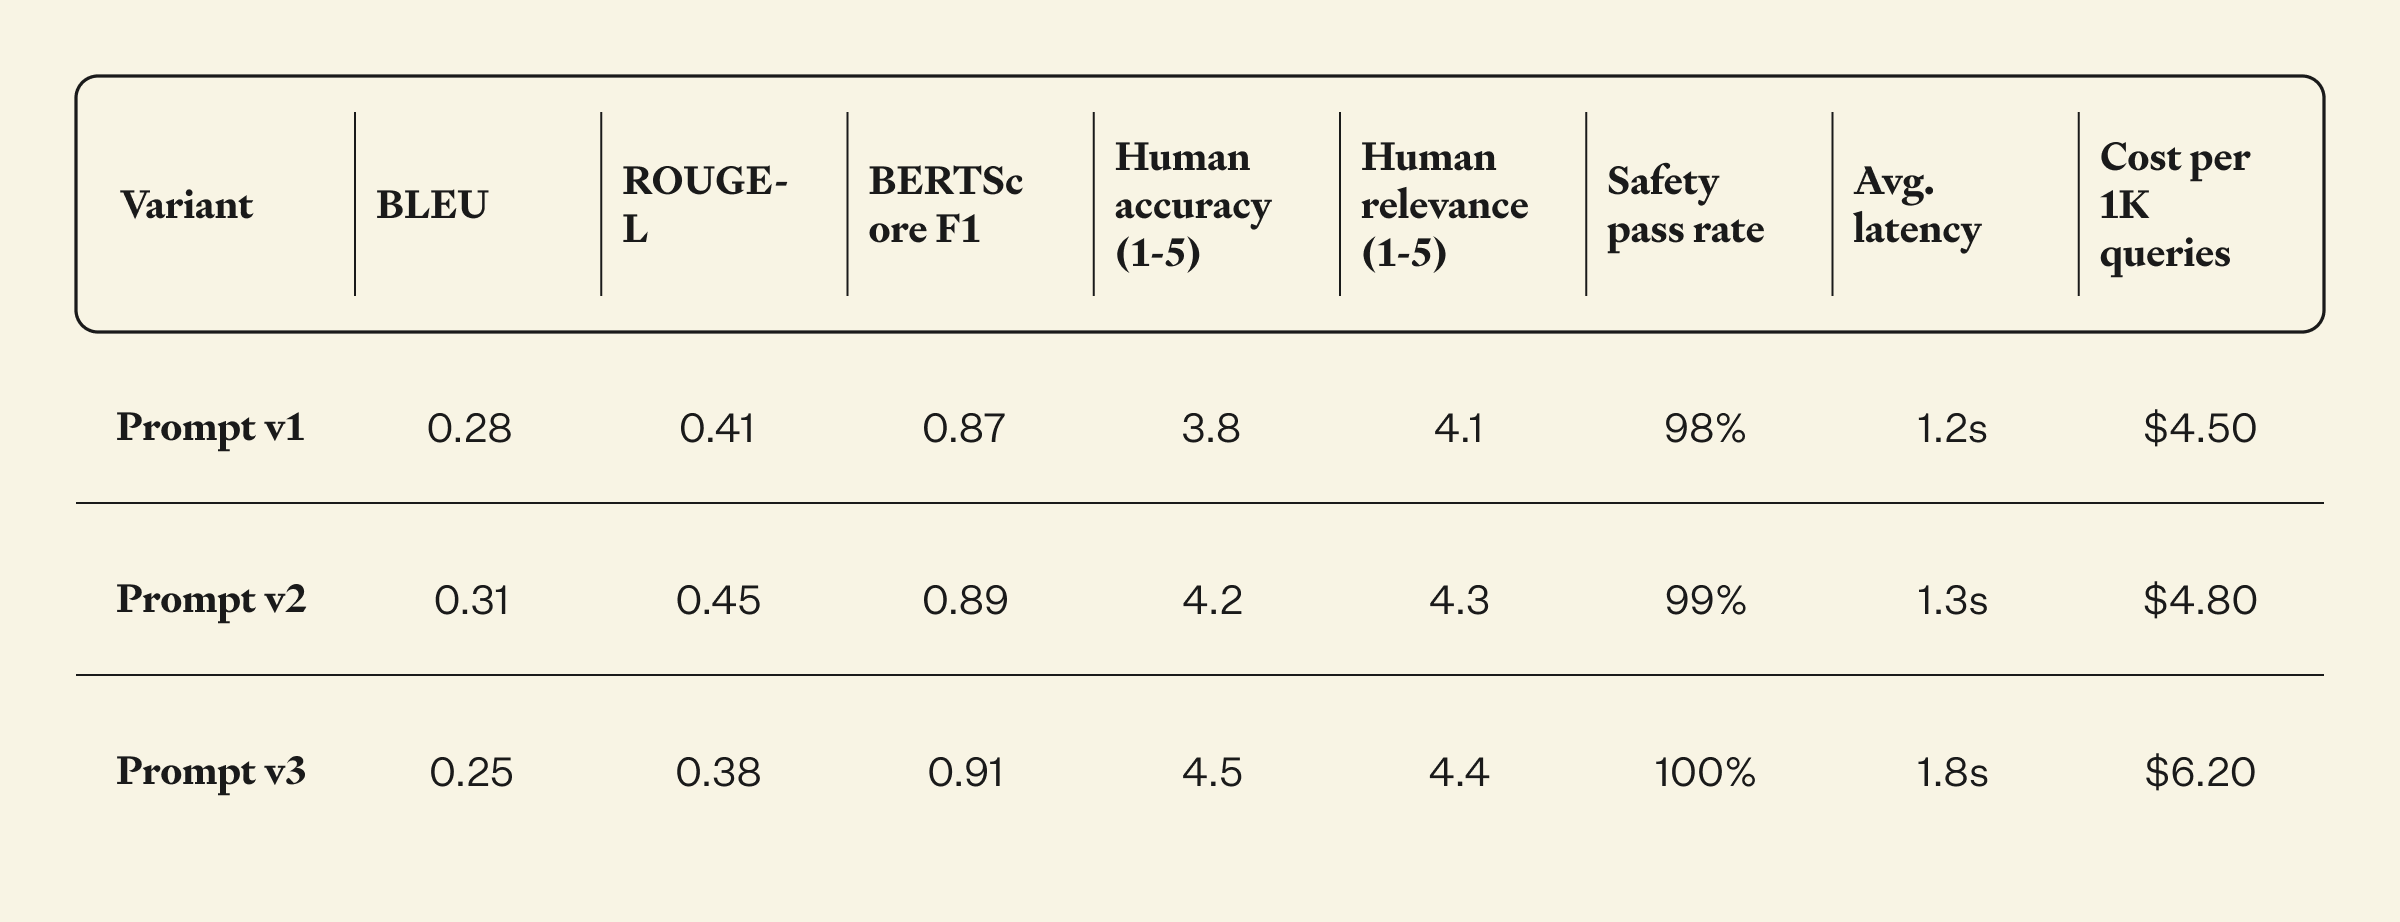
Click on the image above to zoom into full PDF
The scorecard reveals trade-offs that single metrics hide. Prompt v3 scores highest on human evaluation and BERTScore but costs 38% more and adds 50% latency. The right choice depends on whether the use case prioritizes quality ceiling or cost efficiency.
Here are five improvement strategies, ordered by implementation effort from lowest to highest.
1. Prompt engineering: Refine system prompts, add few-shot examples, and constrain output format. This is often the fastest, cheapest improvement lever and should be exhausted before more resource-intensive approaches.
2. Retrieval optimization: For RAG systems, improving retrieval quality (better chunking, re-ranking, source freshness) often improves output quality more than changing the model itself.
3. Guardrail configuration: Implement output validation rules that catch quality failures before they reach users: factual consistency checks, format validation, safety screening, and confidence thresholds that trigger human review.
Dataiku, the Platform for AI Success, provides LLM Guard Services (Cost Guard, Safe Guard, Quality Guard), which turn evaluation insights into enforced quality standards. Rather than monitoring quality passively and reviewing reports after the fact, Guard Services screen every prompt and response at inference time, blocking outputs that fail defined quality, safety, or cost thresholds before they reach production.
4. Model selection and routing: Different models perform differently on different tasks. Route complex reasoning to frontier models, simple classification to lighter models, and domain-specific tasks to fine-tuned models. The Dataiku LLM Mesh manages this routing with built-in cost and quality controls.
5. Fine-tuning: Train the model on domain-specific data to improve performance on your specific task distribution. This is the highest-effort approach and should be reserved for cases where prompt engineering and retrieval optimization have been exhausted.
A production LLM quality monitoring system requires four components operating continuously.
Log every LLM interaction:
Input prompt
Output response
Model version
Token counts
Latency
Cost
This is the raw data layer that all evaluation depends on.
Run automated metrics (BERTScore, LLM-as-judge, safety screening) on a representative sample of production outputs. Set task-specific alert thresholds for each quality dimension. When a dimension drops below its threshold, the alert triggers investigation.
Schedule structured human review on a weekly or biweekly cycle, drawing on a stratified sample:
Random outputs
Outputs flagged by automated evaluation
Outputs where users provided negative feedback
Use the rubric consistently across review cycles to track quality trends.
Route evaluation findings into the improvement cycle. Findings come from three sources:
Automated alerts
Human review results
User feedback
The improvement cycle itself has four levers:
Prompt refinements
Guardrail updates
Retrieval optimization
Model routing changes
Close the loop so every quality finding becomes a quality improvement.
The concrete next step: Pick one production LLM workflow, implement the evaluation rubric across all six quality dimensions, run automated metrics for one week, and review the results. That baseline tells you where quality stands today and which dimensions need the most attention.
Dataiku connects evaluation, monitoring, and governance in one environment, so the insights from quality monitoring feed directly into the guardrails, routing decisions, and approval workflows that improve LLM output quality over time.
Five indicators surface most often: factual errors, relevance drift (a related but different question than the one asked), inconsistent formatting across similar queries, safety failures (bias, toxicity, or PII exposure), and confidence without accuracy, fluent, authoritative answers that are simply wrong.
Partially. Automated metrics (BLEU, ROUGE, BERTScore) scale to production volumes and catch surface-level issues reliably, and LLM-as-judge adds semantic depth. But none fully captures contextual appropriateness or brand alignment, so production systems need automated metrics for breadth plus human review for depth.
Human feedback serves three functions: establishing ground truth for automated metrics to compare against, catching edge cases automated metrics miss, and calibrating whether automated scores match how users and domain experts judge quality. The strongest systems use that feedback to keep refining their evaluation criteria.
Automated metrics run continuously with real-time alerting. Structured human review follows a weekly or biweekly cadence for the first 90 days, shifting to monthly once baselines stabilize. Full evaluation reviews, rubric refinement, benchmark re-testing, run quarterly or whenever the model, prompts, or data sources change.
Four challenges compound at scale: evaluation cost, since LLM-as-judge and human review get expensive at high volumes; metric noise, where aggregate scores mask degradation in specific segments; latency from real-time evaluation; and ground truth that goes stale as policies and domain knowledge change.
Tags