Semantic observability and agent telemetry: maximize AI agent reliability
October 1, 2026/7 min read/Team Dataiku
Agent autonomy changes the standard of proof. A completed workflow, a successful API call, and acceptable latency say little about whether an agent pursued the right objective or made a defensible choice. As a result, enterprises may be operating systems whose decisions they cannot fully explain or defend.According to “7 career-making AI decisions for CIOs in 2026,” based on a Dataiku/Harris Poll survey of 600 enterprise CIOs, 87% say AI agents are already embedded in critical operations, while only 25% have full real-time visibility into every agent running in production.
Closing that gap takes a record connecting each action to the evidence, tool, policy, evaluation, and business result behind it. Semantic observability paired with agent telemetry produces that record, giving technical teams, business owners, governance reviewers, and risk leaders a common basis for judging the reliability of AI and deciding how much authority an agent should hold in production.
This guide covers the concepts, the telemetry signals that matter most, the instrumentation patterns and code behind them, and the operating practices that keep agents governable once they are live.
Telemetry captures model calls, retrieval, tool activity, handoffs, failures, and resource use.
Semantic context shows whether an agent acted within its objective, evidence, permissions, and expected result.
The OpenTelemetry semantic conventions for generative AI (GenAI) give teams consistent names across frameworks and services.
Reliable operations depend on reading execution data beside evaluations, task outcomes, latency, and cost.

Agent telemetry is the execution record of an agent run: the traces, metrics, logs, and events that capture model calls, retrieval, tool activity, handoffs, failures, and resource use. Semantic observability is the interpretive layer on top of that record, holding what the agent was trying to do, which evidence it accepted, what it was permitted to do, and what the business got as a result.
Application performance monitoring (APM) answers a narrower question. It confirms that services are up, requests are served, and latency sits inside its budget, all of which stay necessary and none of which speak to judgment. An autonomous agent requires a different inquiry: the goal pursued, the evidence accepted, the tools selected, and the business rule applied to the result.
Semantic observability supplies that inquiry by recording intent, source authority, policy checks, evaluation results, reasoning path, and business outcome alongside the execution data. Model requests, retrieval events, retries, and sub-agent handoffs all become interpretable once that context sits next to them.
For enterprise teams, the benefits appear in four areas:
Investigations into reasoning and tool-use defects get shorter, because the record shows which step diverged.
Quality, latency, cost, and behavioral drift surface earlier, before users or downstream systems absorb them.
Audits and approval reviews receive documented evidence rather than assertions.
Agent behavior links directly to business performance, so owners can see which runs produced value.
Those benefits are easiest to see in the failure modes that ordinary monitoring reports as successes.
Telemetry captures what happened; semantic observability explains why it happened and whether the outcome was correct. Read together on one trace, they turn raw execution data into something a team can debug and optimize.
In production, how semantic observability helps agent telemetry comes down to three recurring cases.
An execution loop occurs when an agent repeats the same retrieval, model call, tool action, or self-check without advancing the task. Every one of those steps can succeed technically, so infrastructure metrics stay normal and the trace on its own looks healthy. Reading the objective, the prior result, and the stopping rule alongside it shows whether the repetition added information or only spent latency and tokens.
Tool-selection errors surface once intent and permission scope are read beside the tool call. A claims agent that triggers a payment action after a customer asks for a coverage explanation will log a successful call, because the call itself was well formed. Standard monitoring cannot reveal the mismatch; it becomes visible only when the request is recorded next to the action taken.
Retrieval failures work the same way. Once source status and authority are captured with ranking data, a high similarity score that favored a retired policy over the current version stops looking like a good retrieval. The trace shows what came back; the semantic fields explain why that choice weakened every decision downstream of it.
The relationship reduces to a simple framework:
Telemetry = operational visibility
Semantic observability = behavioral visibility
Together = complete agent observability
Telemetry without semantic context gives an incomplete view of agent performance, which is why investigators working from traces alone tend to start in the wrong place.
They improve reliability by making agent decisions, tool use, and outcomes visible while a run is still recoverable, rather than after a user reports a bad result.
No single metric proves that an agent is reliable. Low latency can coexist with unsupported reasoning, and a completed task may still omit required evidence. Cost spikes may point to repeated retrieval, oversized context, avoidable retries, or a weak stopping condition that never fires.
Correlating the execution record with task status, latency, cost, and evaluation scores is what surfaces the four failure modes teams care about most: hallucinations, reasoning loops, tool errors, and cost anomalies. Each one can then be caught before it reaches users or operations.
Consider a fraud-review agent at a bank. Throughput looks healthy, cases clear at the expected rate, and no exception is raised, yet a share of the completed cases lack a mandatory source. The execution history pinpoints the step where the source was dropped, and the evaluation explains why those cases should not have passed review.
That distinction has consequences at the approval gate. According to “Global AI confessions report: data leaders edition,” based on a Dataiku/Harris Poll survey of 812 data leaders, only 19% always require AI agents to show their work before approval, and 52% have already delayed or blocked an agent deployment over explainability concerns.
Monitoring and evaluation have to continue after deployment, because models, prompts, sources, APIs, and request patterns all change. Reliable agents at scale depend on that loop running continuously rather than on a single validation before launch.
Dataiku, the Platform for AI Success, is the orchestration layer enterprises use to build, deploy, and govern analytics, models, and AI agents across any infrastructure. It unifies data preparation, machine learning, GenAI, agents, and governance in one environment, and its guidance on evaluating enterprise agents connects task quality with business value, oversight, and operating performance.
Dataiku Agent Management shows what connecting telemetry to business outcomes looks like in practice. It gives technical and business teams one view of performance, behavioral drift, governance status, and business KPIs across agents built on different platforms.
Three signal types matter most, and the OpenTelemetry semantic conventions for GenAI supply the names that keep them consistent across frameworks and services.
Signals can be correlated only when they belong to the same execution. An OpenTelemetry trace represents the full agent run for each production task, and when a new trace begins, OpenTelemetry generates a trace ID for the root span.
Instrumentation then maintains that trace context inside the running process and propagates it across HTTP requests and queued messages, which keeps model calls, retrieval, tools, and sub-agent work attached to the same task.
Within a single trace, three signal types carry the record:
Traces: Span names, operation names, agent identity, model calls, and tool calls
Metrics: Duration, token counts, evaluation scores, task success, and cost
Logs and events: Policy exceptions, tool errors, approvals, source changes, and corrections
Those conventions provide common names for agent, model, tool, token, and evaluation data. They now live in a repository of their own, separate from the core specification, so teams instrumenting agents in production keep telemetry consistent by pinning a specification version and managing schema revisions deliberately rather than tracking the standard continuously.
Agent-specific fields are the newest part of the surface, and an evaluation score means nothing without the criterion recorded next to it. If an internal schema already uses shorthand labels such as agent.name or eval.score, map them explicitly to the OpenTelemetry attributes below, so dashboards built on one naming style still read runs instrumented in the other.
The attributes below are the ones most production agent runs need, ready to copy from the GenAI conventions:
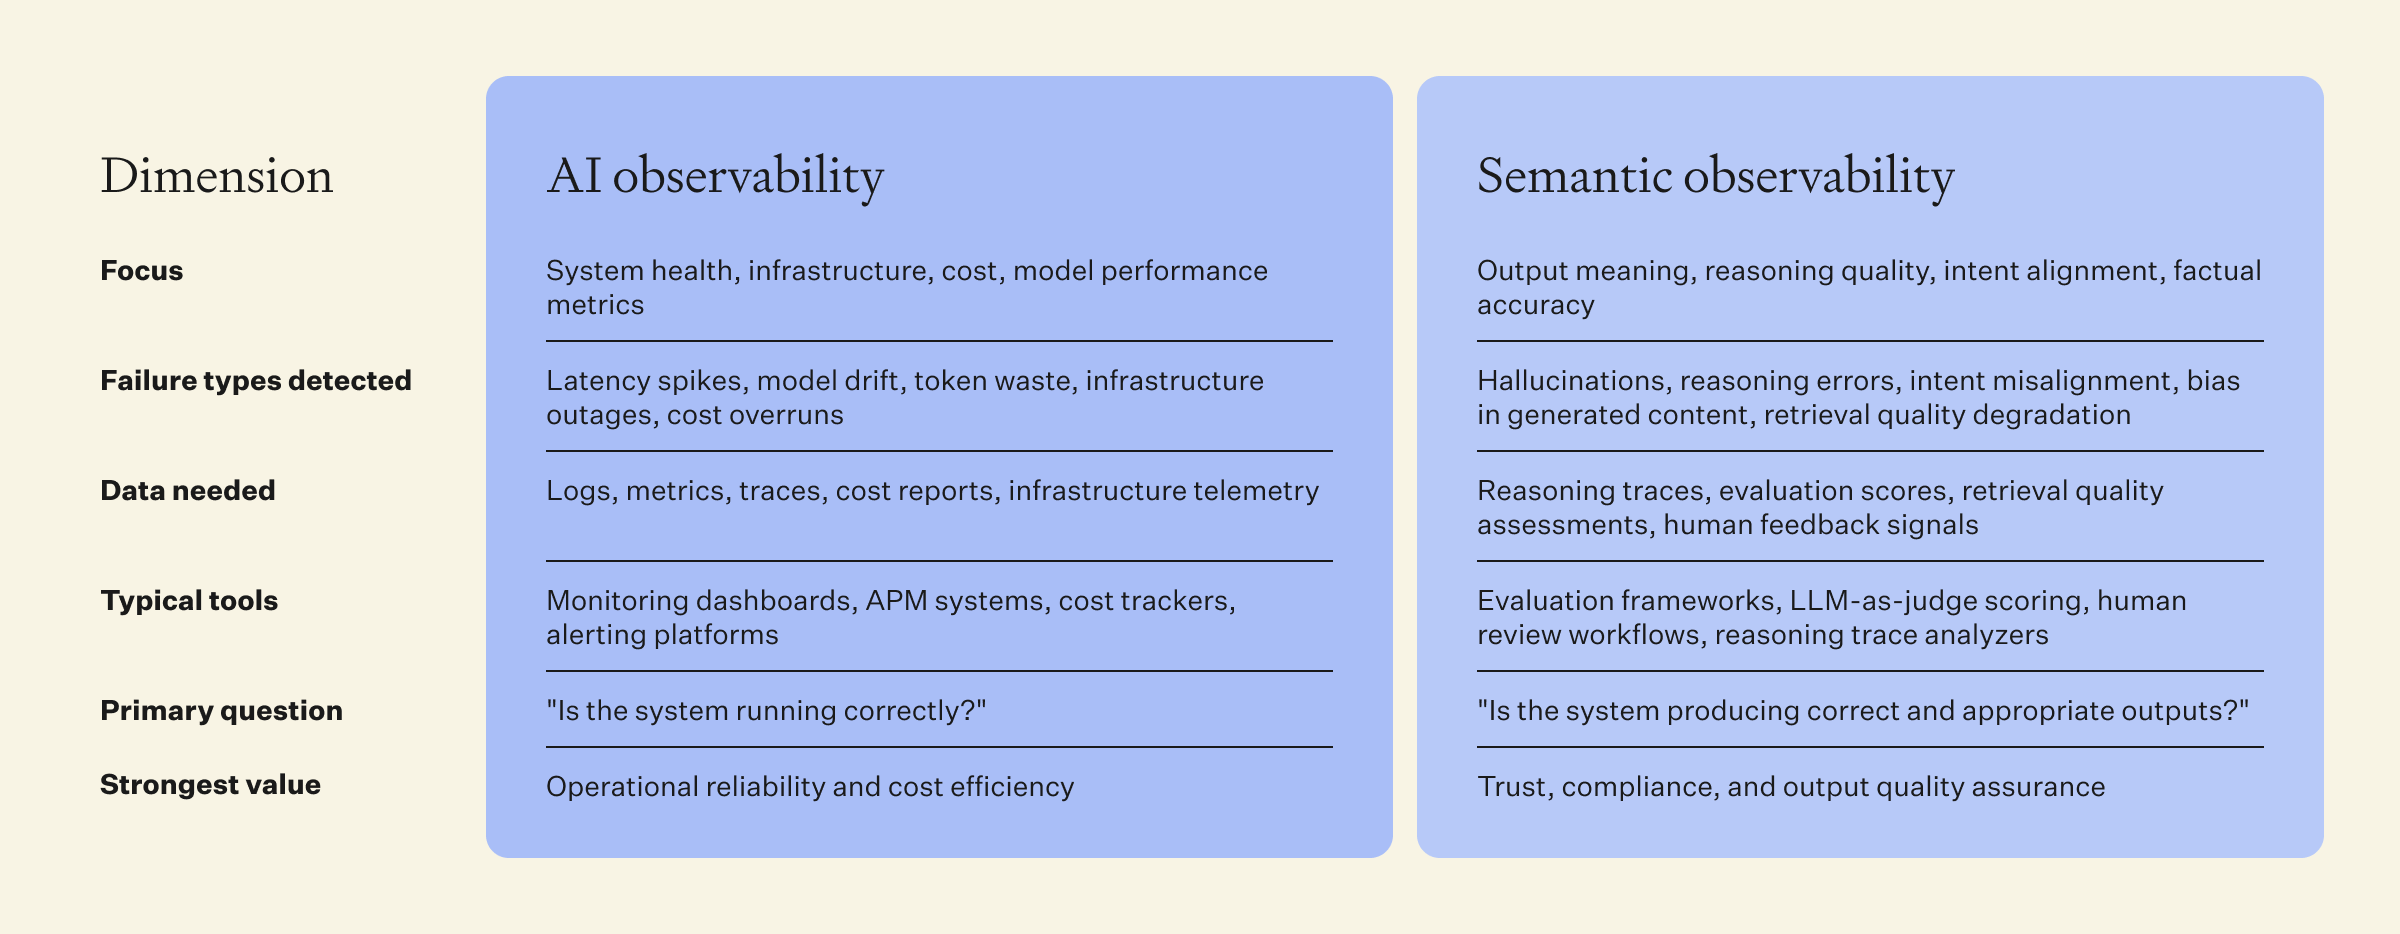
Click on the image above to zoom into full PDF
The Python example applies those attributes to one agent run, recording agent identity, task status, evaluation result, and any technical error in the same span:
from opentelemetry import trace
from opentelemetry.trace import Status, StatusCode
tracer = trace.get_tracer("claims-agent")
def review_claim(agent, request):
with tracer.start_as_current_span(
"invoke_agent claims_review",
attributes={
"gen_ai.operation.name": "invoke_agent",
"gen_ai.agent.name": "claims_review",
},
) as span:
try:
result = agent.invoke(request)
span.set_attribute("app.task.success", result.approved)
span.add_event("gen_ai.evaluation.result", {
"gen_ai.evaluation.name": "groundedness",
"gen_ai.evaluation.score.value": float(result.score),
})
return result
except Exception as exc:
span.record_exception(exc)
span.set_status(Status(StatusCode.ERROR))
raise
This invocation can complete without an exception and still produce an unacceptable result. Setting app.task.success separately from the span status keeps task status apart from technical status, so the distinction survives aggregation.
Two instrumentation patterns dominate, and most enterprises running several agent frameworks end up combining them.
Baked-in framework instrumentation captures model calls, retrieval, tool use, and framework events with little setup. An external OpenTelemetry library adds a shared structure for naming, export, masking, and retention across frameworks and services.
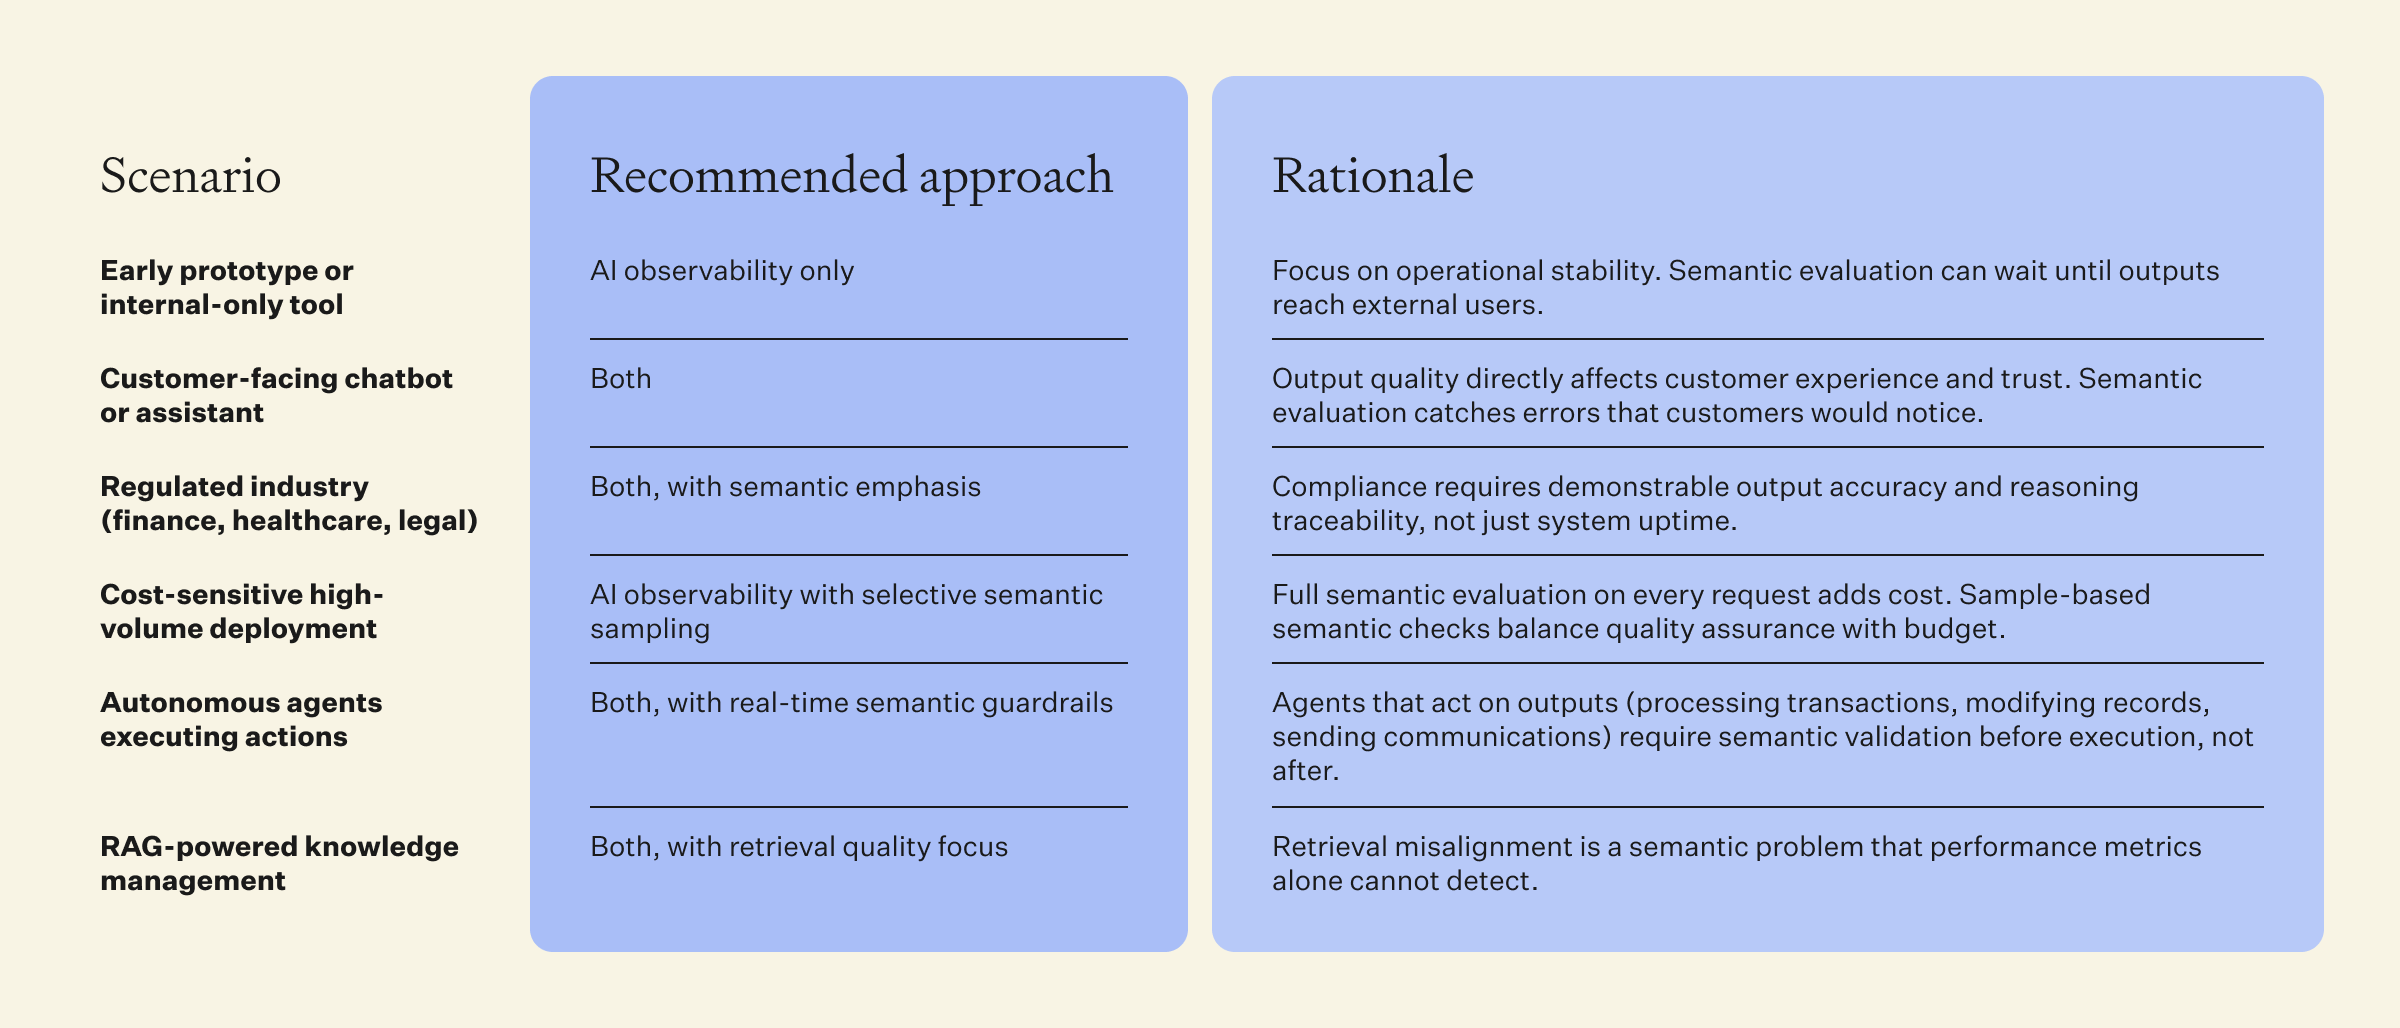
Click on the image above to zoom into full PDF
Enterprises running several frameworks often combine the two: native telemetry for routine execution and semantic fields for intent, policy, evaluation, and business outcome.
The TypeScript example keeps a parent span active during nested model and tool calls so the surrounding work inherits the same trace context:
import { SpanStatusCode, trace } from "@opentelemetry/api";
const tracer = trace.getTracer("claims-agent");
export async function reviewClaim(agent, request) {
return tracer.startActiveSpan(
"invoke_agent claims_review",
async (span) => {
try {
span.setAttributes({
"gen_ai.operation.name": "invoke_agent",
"gen_ai.agent.name": "claims_review",
});
return await agent.invoke(request);
} catch (error) {
span.recordException(error as Error);
span.setStatus({ code: SpanStatusCode.ERROR });
throw error;
} finally {
span.end();
}
},
);
}
The active span preserves context within the application. As the run moves across services, queues, tools, and sub-agents, OpenTelemetry propagators carry W3C Trace Context through HTTP headers and message metadata so the pieces stay joined.
Collection policy then decides which fields are recorded, which are masked, who can inspect them, and when the data is deleted.
Prompts, retrieved passages, tool inputs, and outputs are the fields most likely to carry regulated content, so they set that policy. Microsoft's guidance on observability for GenAI and agentic AI systems makes the same point, recommending that capture and retention be governed by data contracts that balance forensic needs against privacy, data residency, and retention obligations.
Implementation runs from the exporter pipeline through to the dashboards a named owner watches, in five steps. Each step ties to a measure, because the reliability of AI in production is only as provable as the evidence collected about it.
Telemetry matters only when a named owner can investigate a signal and verify that the correction holds in later runs.
Choose the exporter path. Send OpenTelemetry Protocol (OTLP) data through an OpenTelemetry Collector or directly to an approved backend, then measure trace completeness across model calls, tools, queues, and sub-agent handoffs.
Align the schema. Apply the current GenAI conventions, add enterprise fields for task, owner, risk, evaluation, and outcome, and measure schema conformance across frameworks and backends.
Set tail-based sampling around evaluation results. Retain failed, slow, high-cost, high-risk, and low-scoring runs once the full trace is available, sample routine successes more lightly, and measure the share of consequential runs preserved.
Build dashboards around operating questions. Combine latency, task success, evaluation scores, token use, retries, cost per task, and behavioral drift, then measure detection time and alert assignment against the agreed response window.
Close the feedback loop. Route each alert to a named owner, preserve the evidence, document the correction, and track recurrence after release to verify the fix.
Dataiku's guidance on AI observability follows the same shape, tracing each task from user input through prompt construction, model inference, tool calls, and final output, with policy enforcement on data and tool access held in the same system.
A complete operating loop still leaves gaps that no dashboard surfaces on its own. Each of the five below needs a named control, paired with the practice that closes it.
Record child status and expected output at every handoff. A parent agent that reports completion while required child output is missing produces the failure mode most likely to reach a user unnoticed.
Measure token use and cost per completed task rather than per model call alone. Comparing spend against task type and evaluation result is what identifies repeated retrieval, excess context, unnecessary retries, or a weak stopping rule.
Random sampling drops the runs that matter most. A small random sample of a healthy-looking agent mostly captures routine successes, so retention has to be driven by evaluation outcome rather than by volume.
Define evaluation criteria before deployment rather than after the first incident. Groundedness fits research tasks, policy compliance fits regulated work, and case resolution fits service operations. Where professional judgment determines acceptance, record the reviewer's approval as part of the run.
Agent records may include prompts, retrieved passages, tool arguments, outputs, and regulated data. Mask sensitive fields before export, restrict access by role and purpose, set retention periods, and test the controls with realistic payloads rather than synthetic ones.
Telemetry shows what happened, semantic observability explains why, and together they are what make an agent reliable enough to trust with more authority. Run both and that authority can expand on evidence rather than on optimism, without loosening control over quality, cost, risk, or compliance.
Instrument one production candidate this week. Review its traces with the technical and business owners, attach one evaluation and one business outcome to each run, and inspect the runs where the two disagree.
Dataiku unifies observability, evaluation, and governance for AI agents in one operating model.
Traditional APM confirms that services are healthy and requests are served within latency budgets. Semantic observability records why an agent acted as it did: its objective, the evidence it accepted, the tools it was permitted to use, and the business outcome.
Telemetry supplies operational visibility and semantic observability supplies behavioral visibility. Correlated on the same trace, they show both what an agent did and whether it should have done it, which is what makes a run reviewable.
Traces for model, retrieval, and tool activity; metrics for latency, token use, cost, task success, and evaluation scores; and logs and events for policy exceptions, tool errors, approvals, and corrections.
It gives each signal a reason. A repeated retrieval reads as a loop once the stopping rule is visible, and a cost spike reads as oversized context once token use is compared against task type and evaluation result.
Four recur: schema drift across frameworks, sampling that discards the runs worth keeping, sub-agent failures that never reach the parent span, and sensitive content in prompts and tool arguments that must be masked before export.
Tags