AI semantic metrics: what to track beyond accuracy, latency, and cost
October 1, 2026/7 min read/Team Dataiku
Two AI systems answer the same question with different numbers, and both are technically correct according totheir own definitions. One uses gross revenue. The other uses net. But neither metric in your monitoring stack detects the problem because neither system failed. They just disagreed, and nobody knew.
Accuracy, latency, and cost measure execution quality. They tell you the model responded within budget and within time. But they say nothing about whether the response used the right business definition, traced every claim to a verifiable source, or produced an output that an analyst would trust enough to put in front of a CFO without re-running it first.
That is the measurement gap this guide addresses. The four categories of AI semantic metrics, the six-metric production scorecard, and the step-by-step implementation path outlined beloware built for teams deploying AI in analytics, reporting, and decision support. These are contexts where business alignment and governed data matter as much as technical performance.
AI semantic metrics measure whether AI outputs are meaningful, trustworthy, explainable, business-aligned, and grounded in governed data, not just technically correct.
They complement traditional large language model (LLM) evaluation metrics (accuracy, latency, cost) by assessing the quality of decisions and answers rather than onlythe quality of technical execution.
Four categories define the semantic metric space: governance and consistency, contextual relevance, explainability and faithfulness, and user trust and adoption.
Six production metrics (exactness, faithfulness, coverage, governance conformance, P95 latency, cost efficiency) form a scorecard template that teams can implement this quarter.
Semantic metrics are most valuable where AI outputs inform business decisions, feed into regulatory reporting, or replace human judgment in analytical workflows.

Traditional AI metrics fall short because they measure whether a system executed correctly, not whether it produced the right answer. Accuracy, latency, and cost say nothing about business context, definitional consistency, or whether the person who received the output trusts it.
The common trap: Teams track accuracy, latency, and cost while ignoring risks these metrics cannot detect, including inconsistent answers across AI systems, governance violations where outputs bypass certified definitions, and user mistrust that shows up as analysts re-running queries manually instead of accepting the AI-generated answer.
A real-world pattern: Two AI-powered reporting tools serve the same finance team. One calculates quarterly revenue using gross bookings. The other uses net revenue after returns. Both are "accurate" against their respective definitions. But when both numbers appear on the same executive dashboard, the result is confusion, a reconciliation cycle, and eroded trust in AI-generated analytics. No traditional metric flags this because neither system is technically wrong.
This is where AI semantic metrics fill the gap. They track whether the AI system used the right definition, cited verifiable evidence, and delivered an output that aligns with the organization's governed data standards, not just whether the system responded quickly and cheaply.
For LLM evaluation metrics specifically, the implication is clear: BLEU (bilingual evaluation understudy), ROUGE (recall-oriented understudy for gisting evaluation), and BERTScore (a metric built on BERT, or bidirectional encoder representations from transformers) measure output quality against reference text. Semantic metrics measure output quality against business truth.
That risk is showing up in enterprise data too. According to McKinsey's 2026 AI Trust Maturity Survey, 74% of respondents cite inaccuracy as a highly relevant AI risk. Separately, only 30% have reached a mature governance practice capable of catching it before it reaches a decision-maker.Semantic metrics are built to close exactly that gap.
AI semantic metrics are measures that evaluate whether AI outputs are meaningful, trustworthy, explainable, business-aligned, and grounded in governed data.
They complement traditional metrics rather than replacing them.
Traditional metrics answer: "Did the system perform well?"
Semantic metrics answer: "Did the system produce the right answer for the right reasons, using governed definitions, with traceable evidence?"
The distinction from conventional LLM evaluation metrics is scope. LLM evaluation metrics (perplexity, BLEU, ROUGE, BERTScore, human preference scores) focus primarily on model performance: How well did the model generate text? Semantic metrics focus on decision quality: How well did the system produce a trustworthy, business-aligned answer?
AI semantic metrics assess four dimensions:
Whether the output used certified, governed definitions (governance)
Whether it addressed the user's actual question in context (relevance)
Whether every claim is traceable to source data (explainability)
Whether users trust the output enough to act on it without manual verification (adoption)
Four categories organize the semantic metrics that enterprises should track. Each category maps to a specific governance, relevance, explainability, or trust requirement, and feeds into the production scorecard detailed later in this guide.
Governance and consistency measures the percentage of queries answered using certified, governed definitions from the semantic layer rather than ad hoc or ungoverned calculations.
Formula: (Queries resolved using certified entities / Total queries) x 100
Target threshold: 95% or higher. Drops below this threshold signal definition drift (governed definitions falling out of date) or ungoverned workarounds (teams bypassing the semantic layer to get faster answers)
Instrumentation: Capture query metadata that tags whether each query resolved through the governed semantic layer or through an alternative path. Semantic layer query logs provide this data directly.
Connection to governance maturity: Organizations with high governance conformance scores are better positioned for regulatory audits because every AI output can be traced to a certified definition with documented lineage.
Contextual relevance measures the ratio of responses that correctly resolve ambiguous terms on first attempt without requiring user clarification.
A query about "Q3 revenue" is ambiguous: Which fiscal calendar? Gross or net? Which business unit? A system with high contextual relevance resolves these ambiguities using the user's context (role, department, prior queries) and the organization's semantic definitions, rather than asking the user to disambiguate or returning a generic answer.
Measurement approach: Sample random queries weekly, have subject matter experts score whether the response addressed the user's intent on the first attempt, and track the ratio over time. Knowledge-graph hit-rate (the percentage of queries where the system successfully resolved entity references against the knowledge graph) is the underlying technical metric.
This metric is particularly important for conversational BI and other applicationswhere the user expects the system to understand context rather than requiring explicit specification.
Faithfulness requires that 100% of claims in AI responses are supported by verifiable evidence from source data. Every assertion must trace to a specific data point, calculation, or document.
Scoring framework: Evaluate each claim in the response independently. Score 1 if the claim is supported by a verifiable source. Score 0 if the claim is unsupported, fabricated, or unverifiable.
Target: 100% faithfulness since every claim is cited
This connects directly to retrieval-augmented generation pipelines: Faithfulness measures whether the generation step stayed faithful to the retrieved evidence or introduced unsupported inferences. It also connects to audit trail requirements. In regulated environments, every number in an AI-generated report must trace back to its source data through documented lineage.
User trust rate measures the ratio of AI-generated answers accepted by users without manual correction, override, or re-verification.
Capture methods include three complementary signals that together indicate whether users trust an AI-generated answer:
In-app feedback buttons (thumbs up or thumbs down) rate individual AI-generated answers.
Acceptance logs record whether the user acted on the AI answer or re-ran the query manually.
Follow-up query analysis flags whether the user immediately asked a clarifying question, which signals the first answer was insufficient.
This metric is a leading indicator of AI adoption success. High trust rates correlate with reduced time-to-insight and improved analyst productivity. Low trust rates, even when accuracy metrics are high, signal that the AI system is producing outputs that users do not find credible, usable, or aligned with their expectations.
Implementation follows a three-step workflow:
Map business entities.
Build knowledge graphs.
Link metrics to business outcomes.
The process requires collaboration between data engineering (building the semantic infrastructure), governance teams (certifying entity definitions), and business stakeholders (defining which entities and relationships matter most). Implementation is iterative: Start with the highest-value entities and expand as the semantic layer matures.
Inventory the top 20 to 30 critical business entities: customer, product, revenue, cost, order, account, region. For each entity, define the canonical meaning, its relationships to other entities, and its hierarchies (a product belongs to a category, which belongs to a division).
Establish version control for ontology changes. When the definition of "active customer" changes from "purchased in the last 12 months" to "purchased in the last six months," that change must be versioned, documented, and propagated to every system that uses the definition.
Start with a quick-win scope: Focus on entities tied to the organization's top KPIs and most frequently queried data. Cross-functional entity definition workshops (data engineering, finance, sales, marketing) surface definition conflicts early, before they produce conflicting AI outputs in production.
Knowledge graphs encode entity definitions, relationships, and hierarchies in a queryable structure that AI systems can reference at runtime.
Graph store selection:
Property graphs (Neo4j, Neptune) for relationship-heavy domains with complex traversal queries
RDF stores for standards-heavy environments where interoperability across systems matters
The choice depends on query patterns and integration requirements, not on graph theory preferences.
Edge whitelisting prevents performance problems from uncontrolled graph traversal. Define which relationship types the system is allowed to traverse and set depth limits. Without these controls, a single query can trigger cascading joins that degrade performance and produce irrelevant results.
Graph hit-rate (the percentage of queries where entity references were successfully resolved against the knowledge graph) is the operational metric that measures whether the graph is serving its purpose.
Integration with existing data catalogs and lineage tools ensures that the knowledge graph inherits and extends the organization's existing data governance infrastructure rather than creating a parallel system.
Semantic metrics without business context are technical exercises. Linking them to outcomes makes them actionable.
Example mapping: Revenue reporting discrepancies across AI systems map to exactness and faithfulness scores for revenue-related queries. If discrepancies increase, the root cause is likely a governance conformance drop (queries resolving through ungoverned definitions) or a faithfulness drop (the generation step introducing unsupported calculations).
Dashboard design: Pair semantic KPIs with downstream financial or operational metrics on the same view. When an executive sees that governance conformance dropped from 97% to 89% in the same quarter that revenue reporting discrepancies increased, the correlation drives action.
Metric correlation analysis helps prioritize semantic layer improvements: Which metric improvements have the strongest relationship with the business outcomes the organization cares about?
Production measurement requires instrumentation that captures semantic signals at query time and a scorecard that tracks six core metrics continuously.
The following scorecard serves as a template that teams can adapt to their monitoring dashboards.
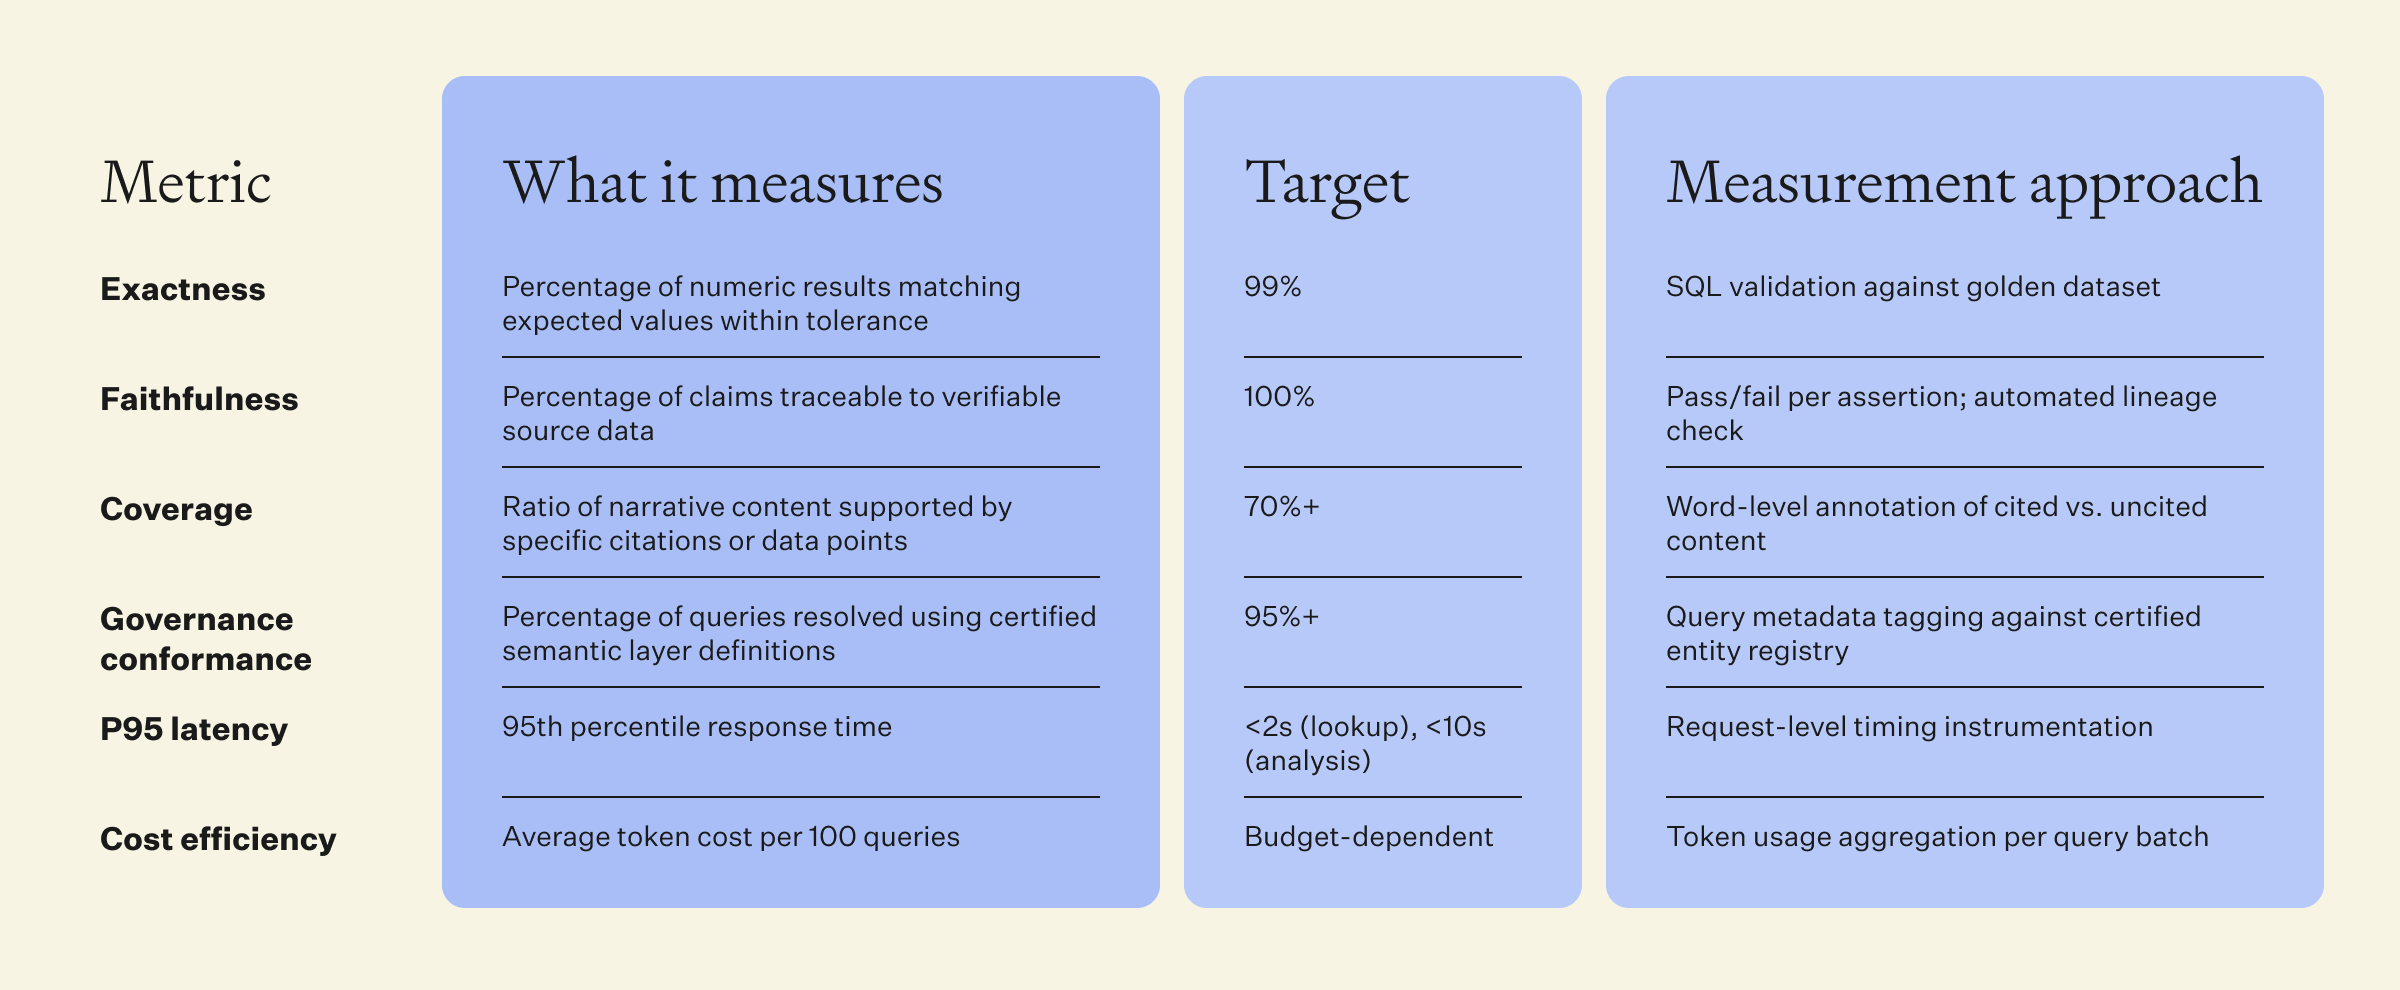
Click on the image above to zoom into full PDF
Recommended cadence:
Continuous instrumentation for volume metrics: Latency, cost, governance conformance)
Daily batch scoring for quality metrics: Exactness, faithfulness, coverage
Alert thresholds set per metric: Any metric crossing its threshold triggers investigation within 24 hours
Dataiku Govern, offered by Dataiku, the Platform for AI Success, tracks governance conformance with audit trails and approval workflows, ensuring that every query resolution path is documented and that conformance drops are traceable to specific definition changes or ungoverned workarounds.
Exactness measures the percentage of numeric results that match expected values within defined tolerance bands. A revenue calculation that returns $10.02M when the certified value is $10.00M is within a 0.2% tolerance. A calculation that returns $12.5M is not.
Validation approach: Compare AI-generated numeric outputs against a golden dataset or certified calculation maintained by the finance or analytics team. Run validation on a daily batch sample and flag results outside tolerance.
Industry target: 99% exactness for production semantic layer
Faithfulness requires that every claim in the AI response traces to source data with verifiable lineage. Scoring is binary per assertion: 1 if the claim is supported by a cited source, 0 if any claim is unsupported.
Automated lineage checks via data catalog integration verify that the cited source exists, is current, and supports the specific claim being made. This catches two failure modes: fabricated citations (the source does not exist) and misattributed citations (the source exists but does not support the claim).
Coverage measures the ratio of narrative content in AI responses that is supported by specific citations or data points. A response where 30% of the text is unsupported assertion is a coverage failure, even if the supported portions are accurate.
Baseline target: 70% coverage for root-cause analysis and diagnostic queries where analytical depth matters. Lower thresholds may be acceptable for summary-level outputs where brevity is the priority. Low coverage leads to user distrust and rework: Analysts re-verify unsupported claims manually, eliminating the efficiency gain the AI system was deployed to provide.
Governance conformance measures the percentage of AI responses that resolve queries using certified, governed definitions from the semantic layer rather than ad hoc calculations.
Measurement: Compare query metadata tags against the certified entity registry. Any query that bypasses the governed path is flagged. Sustained drops below the 95% target signal definition drift (governed definitions are stale or incomplete) or ungoverned workarounds (users or systems routing around the semantic layer because
it does not serve their needs).
Dataiku Govern supports conformance tracking through approval workflows and lineage documentation, connecting semantic layer definitions to the AI systems that consume them.
P95 latency measures the 95th percentile response time, meaning 95% of queries
respond faster than this threshold. P95 matters more than average latency because it reflects the experience of the slowest queries, which are often the most complex and most important.
Target bands:
Under two seconds for simple lookups and entity resolutions
Under ten seconds for root-cause analysis and multi-step diagnostic queries
Optimization strategies:
Semantic caching of common entity definitions: Avoiding repeated graph traversal for frequently queried entities
Pre-computation of aggregate metrics at the semantic layer
Query plan optimization for complex graph traversals
Cost efficiency tracks the average token cost per 100 queries for budget management and trend analysis.
The critical practice: Pair cost tracking with quality scores. Cost reduction that degrades exactness or faithfulness is a false economy. A cost-per-insight formula (total token spend / number of queries that met all quality thresholds) ties cost to business value rather than raw token volume, preventing optimization strategies that reduce spend by reducing quality.
Four implementation traps recur most often, each paired with a preventive practice teams can put in place before it causes damage.
Exploding joins from uncontrolled graph traversal: A single entity resolution query that follows every relationship path can cascade into thousands of joins, degrading performance and returning irrelevant results.
Prevention: Implement edge whitelisting (define which relationship types are allowed) and depth limits (maximum traversal hops per query).
Stale embeddings causing relevance drift: Vector embeddings used for semantic similarity degrade as the underlying data and definitions evolve. An embedding generated six months ago may no longer accurately represent the current definition of an entity.
Prevention: Schedule weekly vector index refresh and monitor relevance scores for decay trends.
Metric definition drift across teams: When the analytics team and the AI team use different definitions of the same metric, the semantic layer has failed its primary purpose.
Prevention: Enforce a single source of truth via the semantic layer with version-controlled definitions, and require cross-functional review of definition changes before deployment.
Access control leaks exposing sensitive data: Semantic layer queries that resolve entity references may inadvertently expose data that the querying user is not authorized to see.
Prevention: Apply row-level security at the semantic layer level, not at query time, so security checks are part of entity resolution rather than a post-processing filter.
Six semantic metrics, tracked alongside accuracy, latency, and cost, give enterprise teams visibility into whether AI outputs are not just technically correct but meaningful, trustworthy, and business-aligned.
Three actions get this started this week:
Establish baseline measurements for exactness and governance conformance using the scorecard template above.
Identify the top five business entities where semantic consistency matters most and confirm their definitions are current and governed.
Configure alerting on governance conformance and faithfulness so drops surface within 24 hours instead of during quarterly reviews.
Dataiku pairs governed analytics with the monitoring needed to track these KPIs alongside accuracy, latency, and cost in one environment.
Traditional LLM evaluation metrics (BLEU, ROUGE, BERTScore, perplexity) measure how well a model generates text against a reference. AI semantic metrics measure business alignment and grounding in governed data, catching gaps like a model that scores well on BLEU yet uses the wrong revenue definition.
Start with exactness and governance conformance. Exactness validates that numeric outputs match certified values, catching errors like wrong numbers in financial reports. Governance conformance validates that queries resolve through certified definitions, catching inconsistent answers across AI systems.
User trust rate is the direct measure: the ratio of AI-generated answers accepted without manual correction. Faithfulness and coverage are leading indicators, since citing every claim and supporting the narrative increases acceptance. Low trust with high accuracy usually signals a faithfulness gap.
Semantic metrics link output quality to business outcomes by measuring whether systems use the definitions and data sources the business has certified as authoritative. When governance conformance is high, revenue numbers match across systems, and faithful narratives trace back to source data.
Establish baselines from two to four weeks of production data before setting thresholds. For exactness and faithfulness, set thresholds near the observed baseline, typically 99% and 100%, since both are binary correctness measures. Review thresholds after major updates.
Set governance conformance at 95% regardless of baseline, treating any shortfall as a remediation target. For user trust and contextual relevance, set thresholds at the 25th percentile of your baseline and tighten them quarterly as the semantic layer matures.
Tags