


Plugin information
| Version | 1.0.2 |
|---|---|
| Author | Dataiku (Nicolas Vallée, David Behar) |
| Released | 2024-05-17 |
| Last updated | 2024-11-05 |
| License | Software License |
| Source Code | Github |
| Reporting issues | Github |
Description
Survival analysis is a branch of statistics for analyzing the expected duration of time until one event occurs, such as death in biological organisms and failure in mechanical systems. Survival analysis can be used whenever our data is incomplete and not all events have been observed. Such events are called “censored”, and only a lower bound of the duration is known. Survival analysis models provide methods to deal with this incomplete information. This plugin implements standard survival analysis models such as
- Kaplan Meier
- Weibull
- Cox Proportional Hazards
- Random Survival Forest
All of these are implemented with the lifelines package except for Random Survival Forest, which uses scikit-survival.
How to set up
The plugin is available through the plugin store. When downloading the plugin, the user is prompted to create a code environment, it should be on Python 3.7+. The plugin components are listed on the plugin page and can then be used in the instance projects. This plugin requires Dataiku V12.0+.
To use the Cox Proportional Hazards and the Random Survival Forest algorithms, a specific code environment needs to be selected in the runtime environment. This code environment needs the required visual ML packages as well as lifelines (for Cox) and scikit-survival (for Random Survival Forest). To do so, the user must:
- Create a Python3.7+ code environment in Administration > Code Envs > New Env.
- Go to Packages to install.
- Click on Add set of packages.
- Add the Visual Machine Learning packages. Remove the scikit-learn and scipy requirements (they will be added according to lifelines and scikit-survival requirements).
- Add lifelines and scikit-survival
lifelines==0.27.8
scikit-survival==0.22.1; python_version >= ‘3.8’
scikit-survival==0.17.2; python_version == ‘3.7’
scikit-learn==1.3.2; python_version >= ‘3.8’
scikit-learn==1.0.2; python_version == ‘3.7’
- Click on Save and Update.
- Go back to the Runtime Environment
- Select the environment that has been created.
How to use
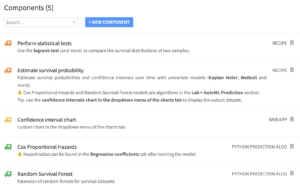
The plugin contains 5 components.
- The “Estimate survival probability” recipe allows the user to fit four univariate models: Kaplan Meier, Weibull, Nelson Aalen, and Piecewise Exponential.
- The “Perform statistical tests” enables the user to see the results of the logrank test.
- The custom chart “Confidence interval chart” is used to display the output of the univariate model recipe and is located in the dropdown menu of the usual charts tab.
- The Cox Proportional Hazards and Random Survival Forest are algorithms in the Lab (visual ML).
Estimate survival probability: Custom Recipe
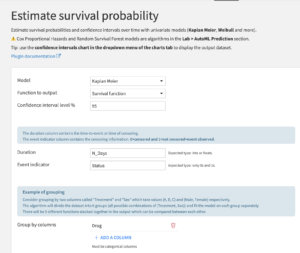
This recipe enables the user to fit 4 univariate models: Kaplan Meier, Weibull, Nelson Aalen, and Piecewise Exponential. The user needs to input:
- The model that is going to be fitted
- The type of function to output (the list will depend on the selected model)
- The confidence interval level
- The duration column (the duration before the event or the censoring)
- The event indicator column (0 means the event is censored and 1 means the event is observed)
- The categorical columns to group by. A distinct model will be fitted on each group.
Perform statistical tests: Custom Recipe
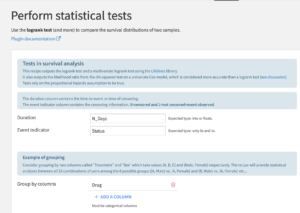
This recipe enables the user to use the logrank test to decide whether the survival curves are statistically different: the null hypothesis is that they are equal. This test relies on the proportional hazards hypothesis to be true. The test will be performed between all possible pairs of groups according to the group by columns specified.
The output dataset also contains the result of the multivariate logrank test and both the log-likelihood ratio test and chi-squared test associated with a univariate Cox model (one binary covariate indicating what group). These last two tests may be more accurate than a logrank test (see the note on lifelines and corresponding discussion on datamethods).
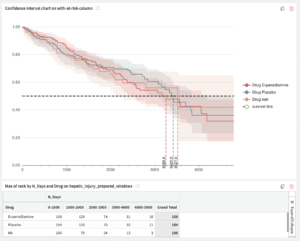
Confidence interval chart: custom chart
This custom chart is implemented as a webapp and can be found in the usual dropdown menu of charts. The user must drag and drop the function he wants to display, the associated confidence intervals, the timeline for the x-axis, and the column that indicates the grouping.
The user can hide confidence intervals and the horizontal black line.
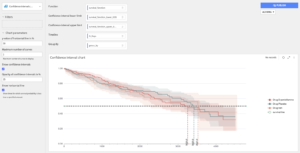
How to obtain a life table
The user may want to display a life table alongside the curves, particularly for life sciences and the financial industry. The confidence interval chart does not produce such a table immediately, but this can be obtained within DSS by going through the following steps:
- use a window recipe
- group in the same way as the chart was built
- sort by decreasing timeline
- add a “rank” in the aggregations
- display the result in a pivot table chart with MAX(rank)
These two charts can be aligned with each other in a Dashboard (see picture below)
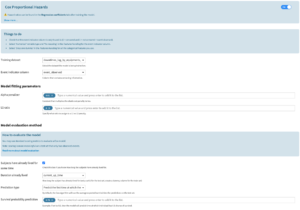
Cox proportional hazards algorithm: visual ML
The user will find this algorithm in the Lab (visual ML). The target feature should be the time column (this is a regression algorithm). The user can configure the algorithm as follows:
- Training dataset: the user must reselect the dataset that is being trained on to retrieve the following event indicator column
- Event indicator column: same format as the univariate models recipe → 0 means the event is censored and 1 means the event is observed
- Alpha penalizer: constant that multiplies the elastic net penalty terms. For unregularized fitting, set the value to 0.
- L1 ratio: specify what ratio to assign to an L1 vs L2 penalty see lifelines docs
- A boolean parameter that allows the user to indicate how long subjects have already lived for.
- Duration already lived: visible if the previous parameter is selected. If the previous boolean parameter is unchecked, these durations are set to 0.
- The user must select no rescaling for this column.
- This column is used for predictions, particularly for scoring a dataset.
- However, it must also be present in the training dataset even if it is not used for training (because only one “features handling” can be specified for one model). The user can add a column with fake times for the training dataset as long as the column names for the training/testing/scoring datasets are the same.
- For the test set, the user should create a column filled with 0s if comparing the predictions with uncensored events
- For a dataset being scored, an example use case would be to create a column in a Prepare recipe with time differences between now and the date of entry in the study (or last restart time for machines) for all living subjects.
- Prediction type: choose to predict either
- the average expected time of survival
- the time of survival with a given level of probability
- the probability of survival at a given time
→ See How to compare Cox and Random Survival forest models for more information
The main output of a Cox model is the list of hazard ratios. These ratios can be found in the regression coefficients tab.
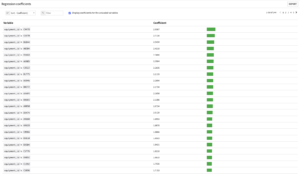
The user should check the box Display coefficients for the unscaled variables and can export this list in a dataset for further analysis.
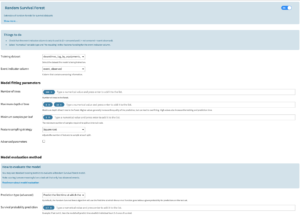
Random survival forest algorithm: visual ML
This algorithm is also in the Lab alongside the Cox algorithm.
- Training dataset, Event indicator column: same comments as for the Cox algorithm
- Prediction type: choose to predict either
- the time of survival with a given level of probability
- the probability of survival at a given time
→ see How to compare Cox and Random Survival forest models for more information
The other parameters are the same as for the standard Random Forest algorithm in DSS.
Random survival forest is implemented with scikit-survival. As of today, it is not possible in this package to specify how long the subjects have already lived for.
How to compare Cox and Random Survival forest models
The performance of Cox and Random Survival forest models can be evaluated using standard metrics (R^2 score, etc.). The plugin does not yet support ‘out of the box’ specific metrics for survival analysis, such as the concordance index or log likelihood ratios.
To be able to use standard metrics, the user must choose the method of predicting a time of survival for every individual in the test set. Indeed, these two models are capable of calculating an entire survival probability curve for every individual in the test set. Therefore, the user must decide how to extract a single time of survival from these survival curves.
By default, the Cox algorithm will predict the mathematical expectancy of survival based on the survival curve. The user may find it interesting to choose the other method, which predicts the time of survival at which the estimated probability level is equal to a given probability value set by the user. The random survival forest will predict values based on the quantile-based method (the expectancy method is not yet implemented for random survival forests).
Note: the predicted times will be compared to the times of survival/censoring of individuals in the test set to obtain the score. Therefore, scoring is more meaningful on a test set that only has observed events. To obtain such a test set, the user can Split and Stack recipes to divide the dataset accordingly and change the ‘Train/Test set’ parameter in the Design.
Limitations
- By default, categorical variables are Dummy encoded, and no Dummy is dropped. To avoid collinearity between variables, the user should select Drop Dummy > Drop one Dummy.
- By default, standard rescaling is applied to the event indicator column, which will modify the expected format containing only 0s and 1s. The user must select Rescaling > No rescaling for this column.
- The plugin does not yet support ‘out of the box’ specific metrics for survival analysis, such as the concordance index or log likelihood ratios.
- It is not yet possible to retrieve the confidence intervals around the Cox hazard ratios. Future improvements of the plugin may include a Model View to be able to do so.
- Filtering in the confidence interval chart does not yet work as expected.