


Plugin information
| Version | 1.0.8 |
|---|---|
| Author | Dataiku |
| Released | 2020-12-01 |
| Last updated | 2022-09-13 |
| License | MIT License |
| Source code | Github |
| Reporting issues | Github |
Description
Evaluating the fairness of machine learning models has been a topic of both academic and business interest in recent years. However, before prescribing any resolution to the problem of model bias, it is crucial to learn more about how biased a model is, by measuring some fairness metrics. This plugin is intended to help you with this measurement task.
Depending on the context and domain, different metrics of fairness can be applied. No model will be perfect toward all the metrics, thus the choice of metric is crucial. The goal of the plugin is to show users in a most transparent way several metrics and the difference between them, and from there users can choose the one that best evaluates the fairness of the situation at hand.
Setup
From DSS 11 on, since the version 1.0.8 of the plugin, you do no longer need a code environment. There is no Python version restriction for the models to use the model view.
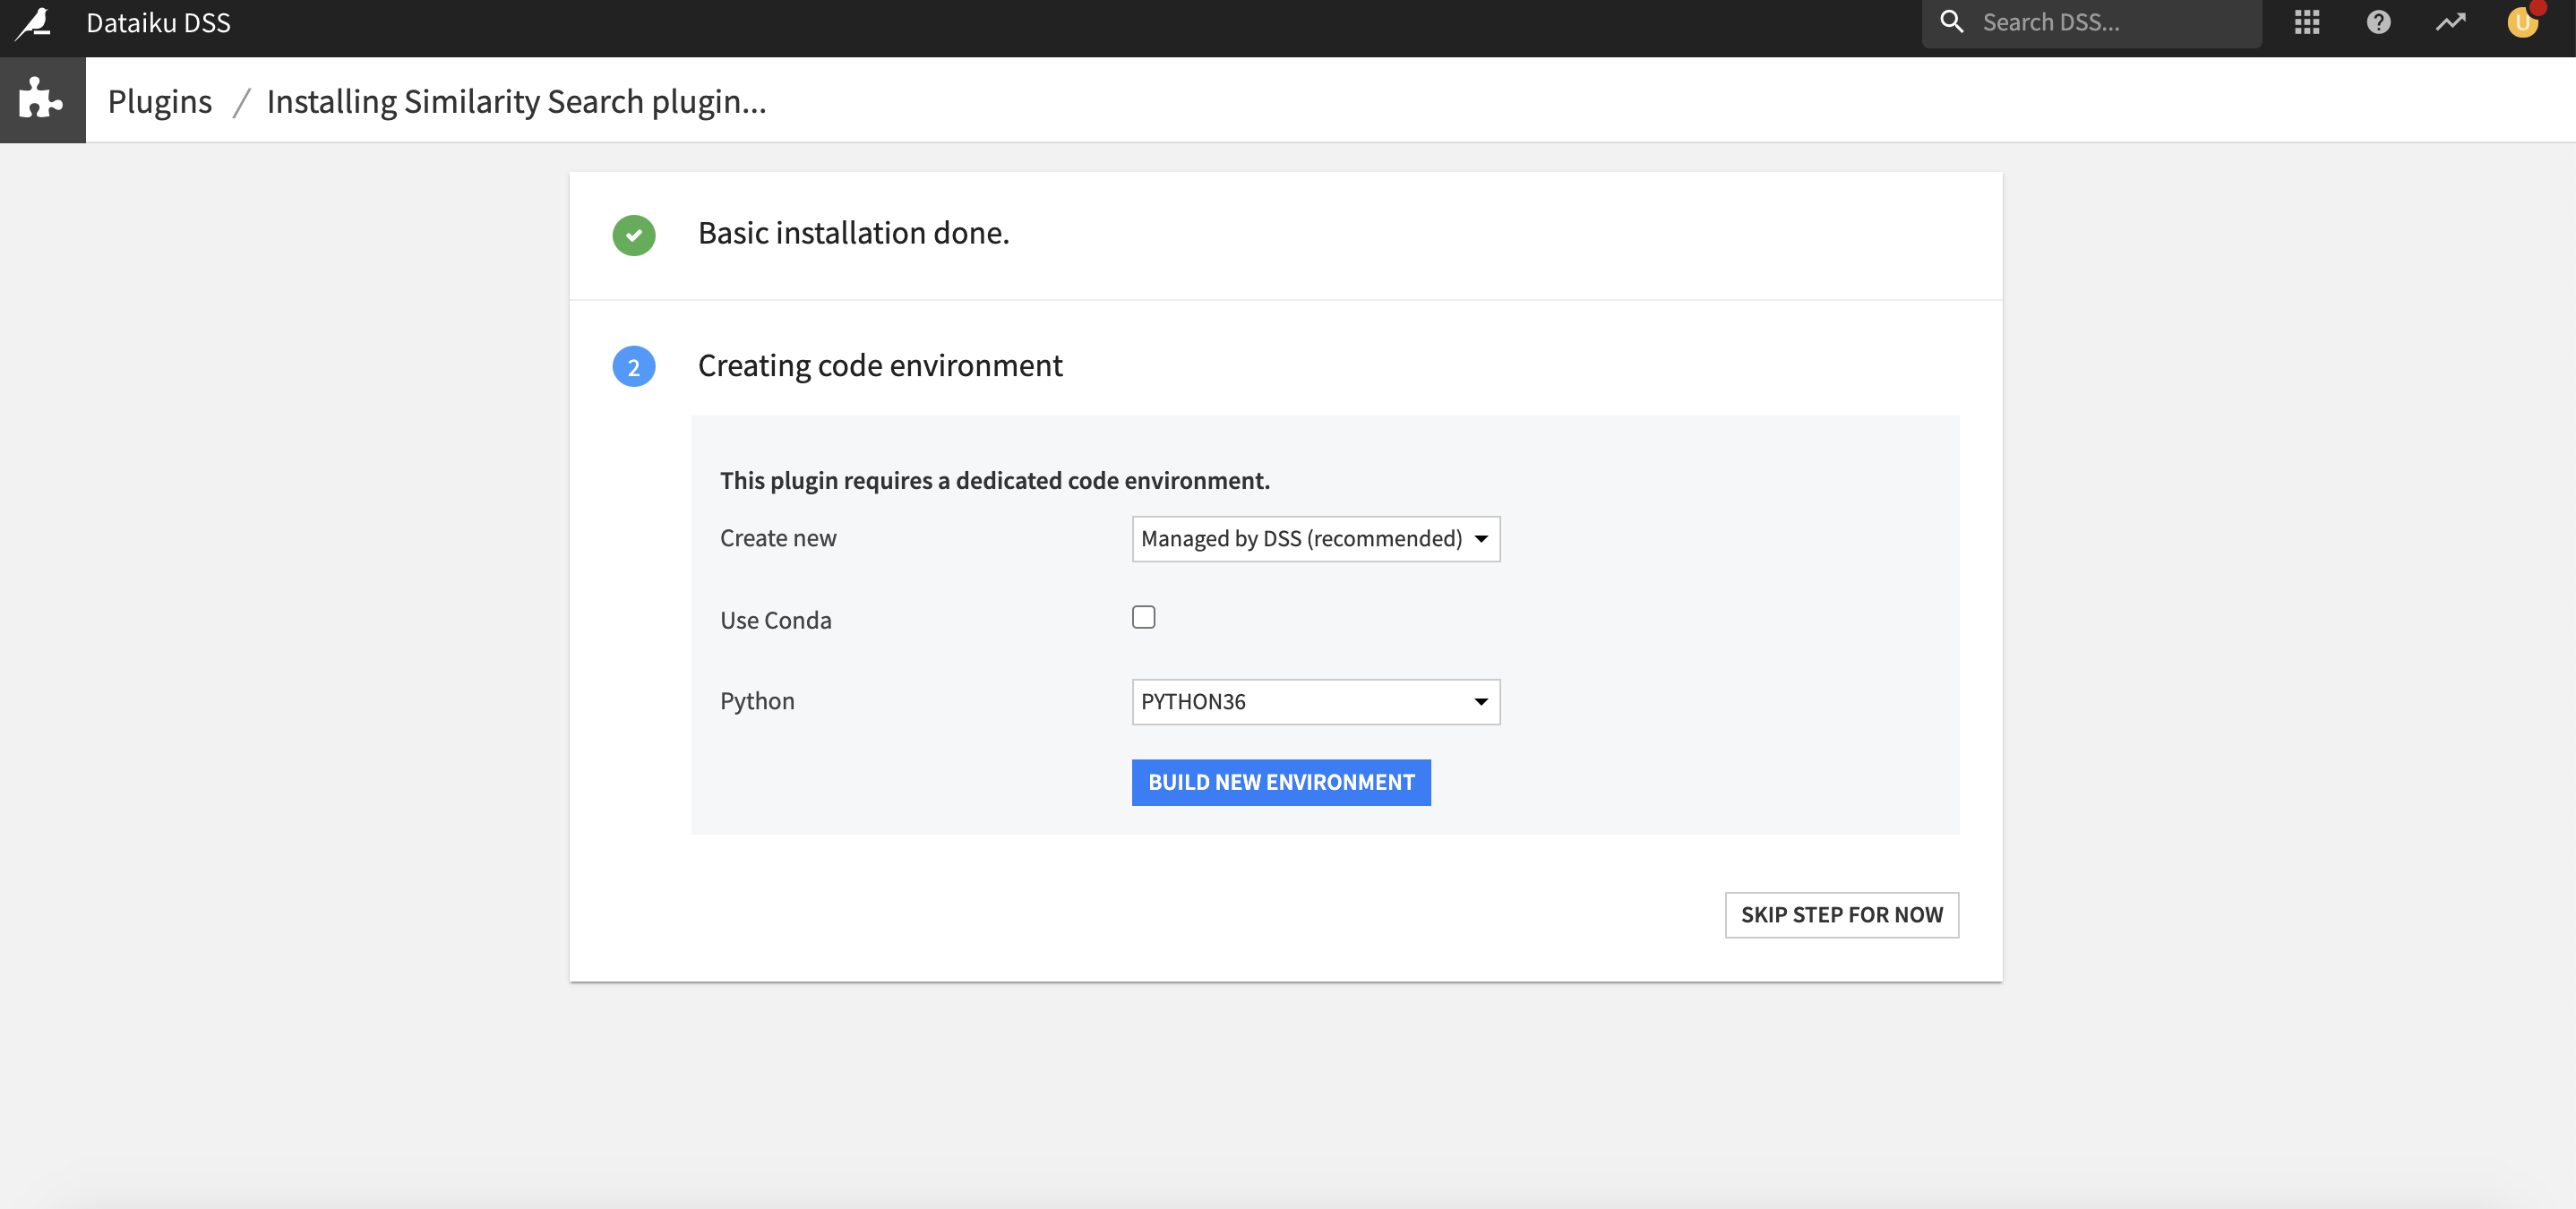
Before DSS 11
Right after installing the plugin, you will need to build its code environment; note that it requires Python version 3.6. The plugin works for Python models trained with Python 3.
How to use
Model views: Model Fairness Report
Reminder: A model view is an additional way to visualize information about a model, model views appear in a deployed model’s version page. This feature was introduced in Dataiku DSS 6.0, if your models were deployed to your flows before v6.0 and you don’t see the “Views” tab, please go back to the saved model screen -> Settings and fill the Model type field with “prediction/py_memory“.
Inputs
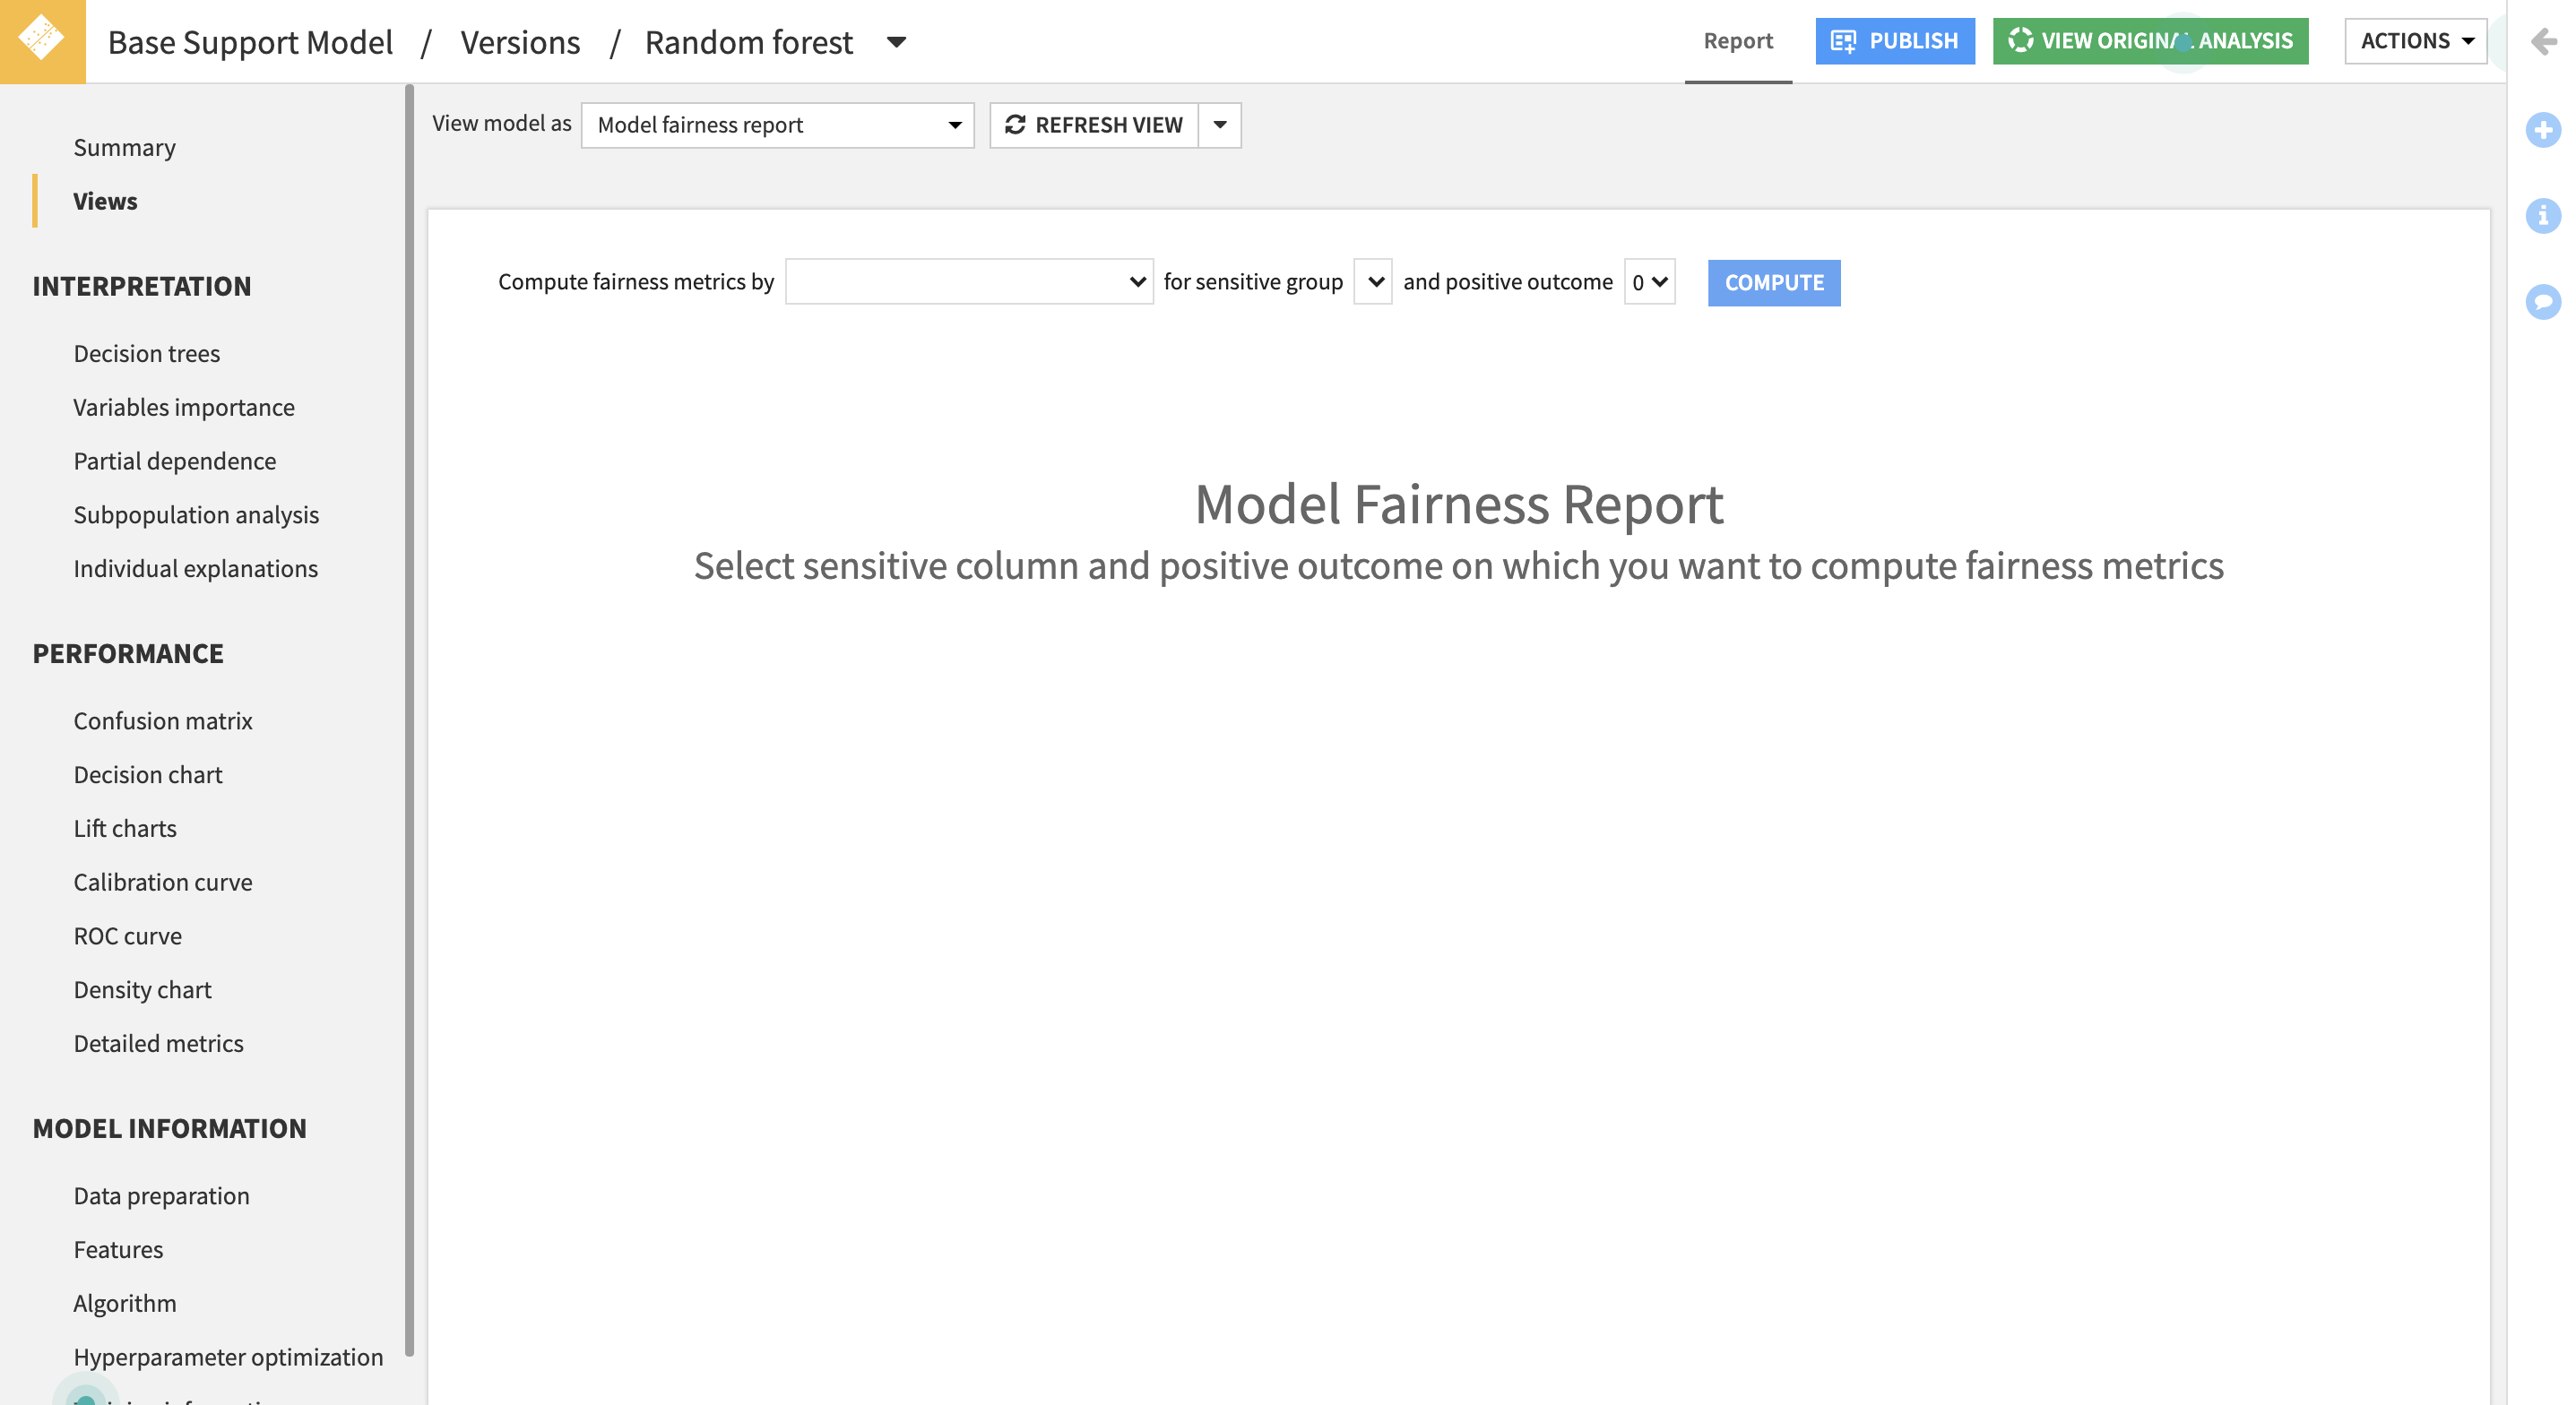
- Sensitive column: the column contains sensitive group based on which we want to compute fairness metric.
- Sensitive group: the reference group from which we will compute the metric discrepancies.
- Positive outcome: the target value that is advantageous.
Metrics and Charts
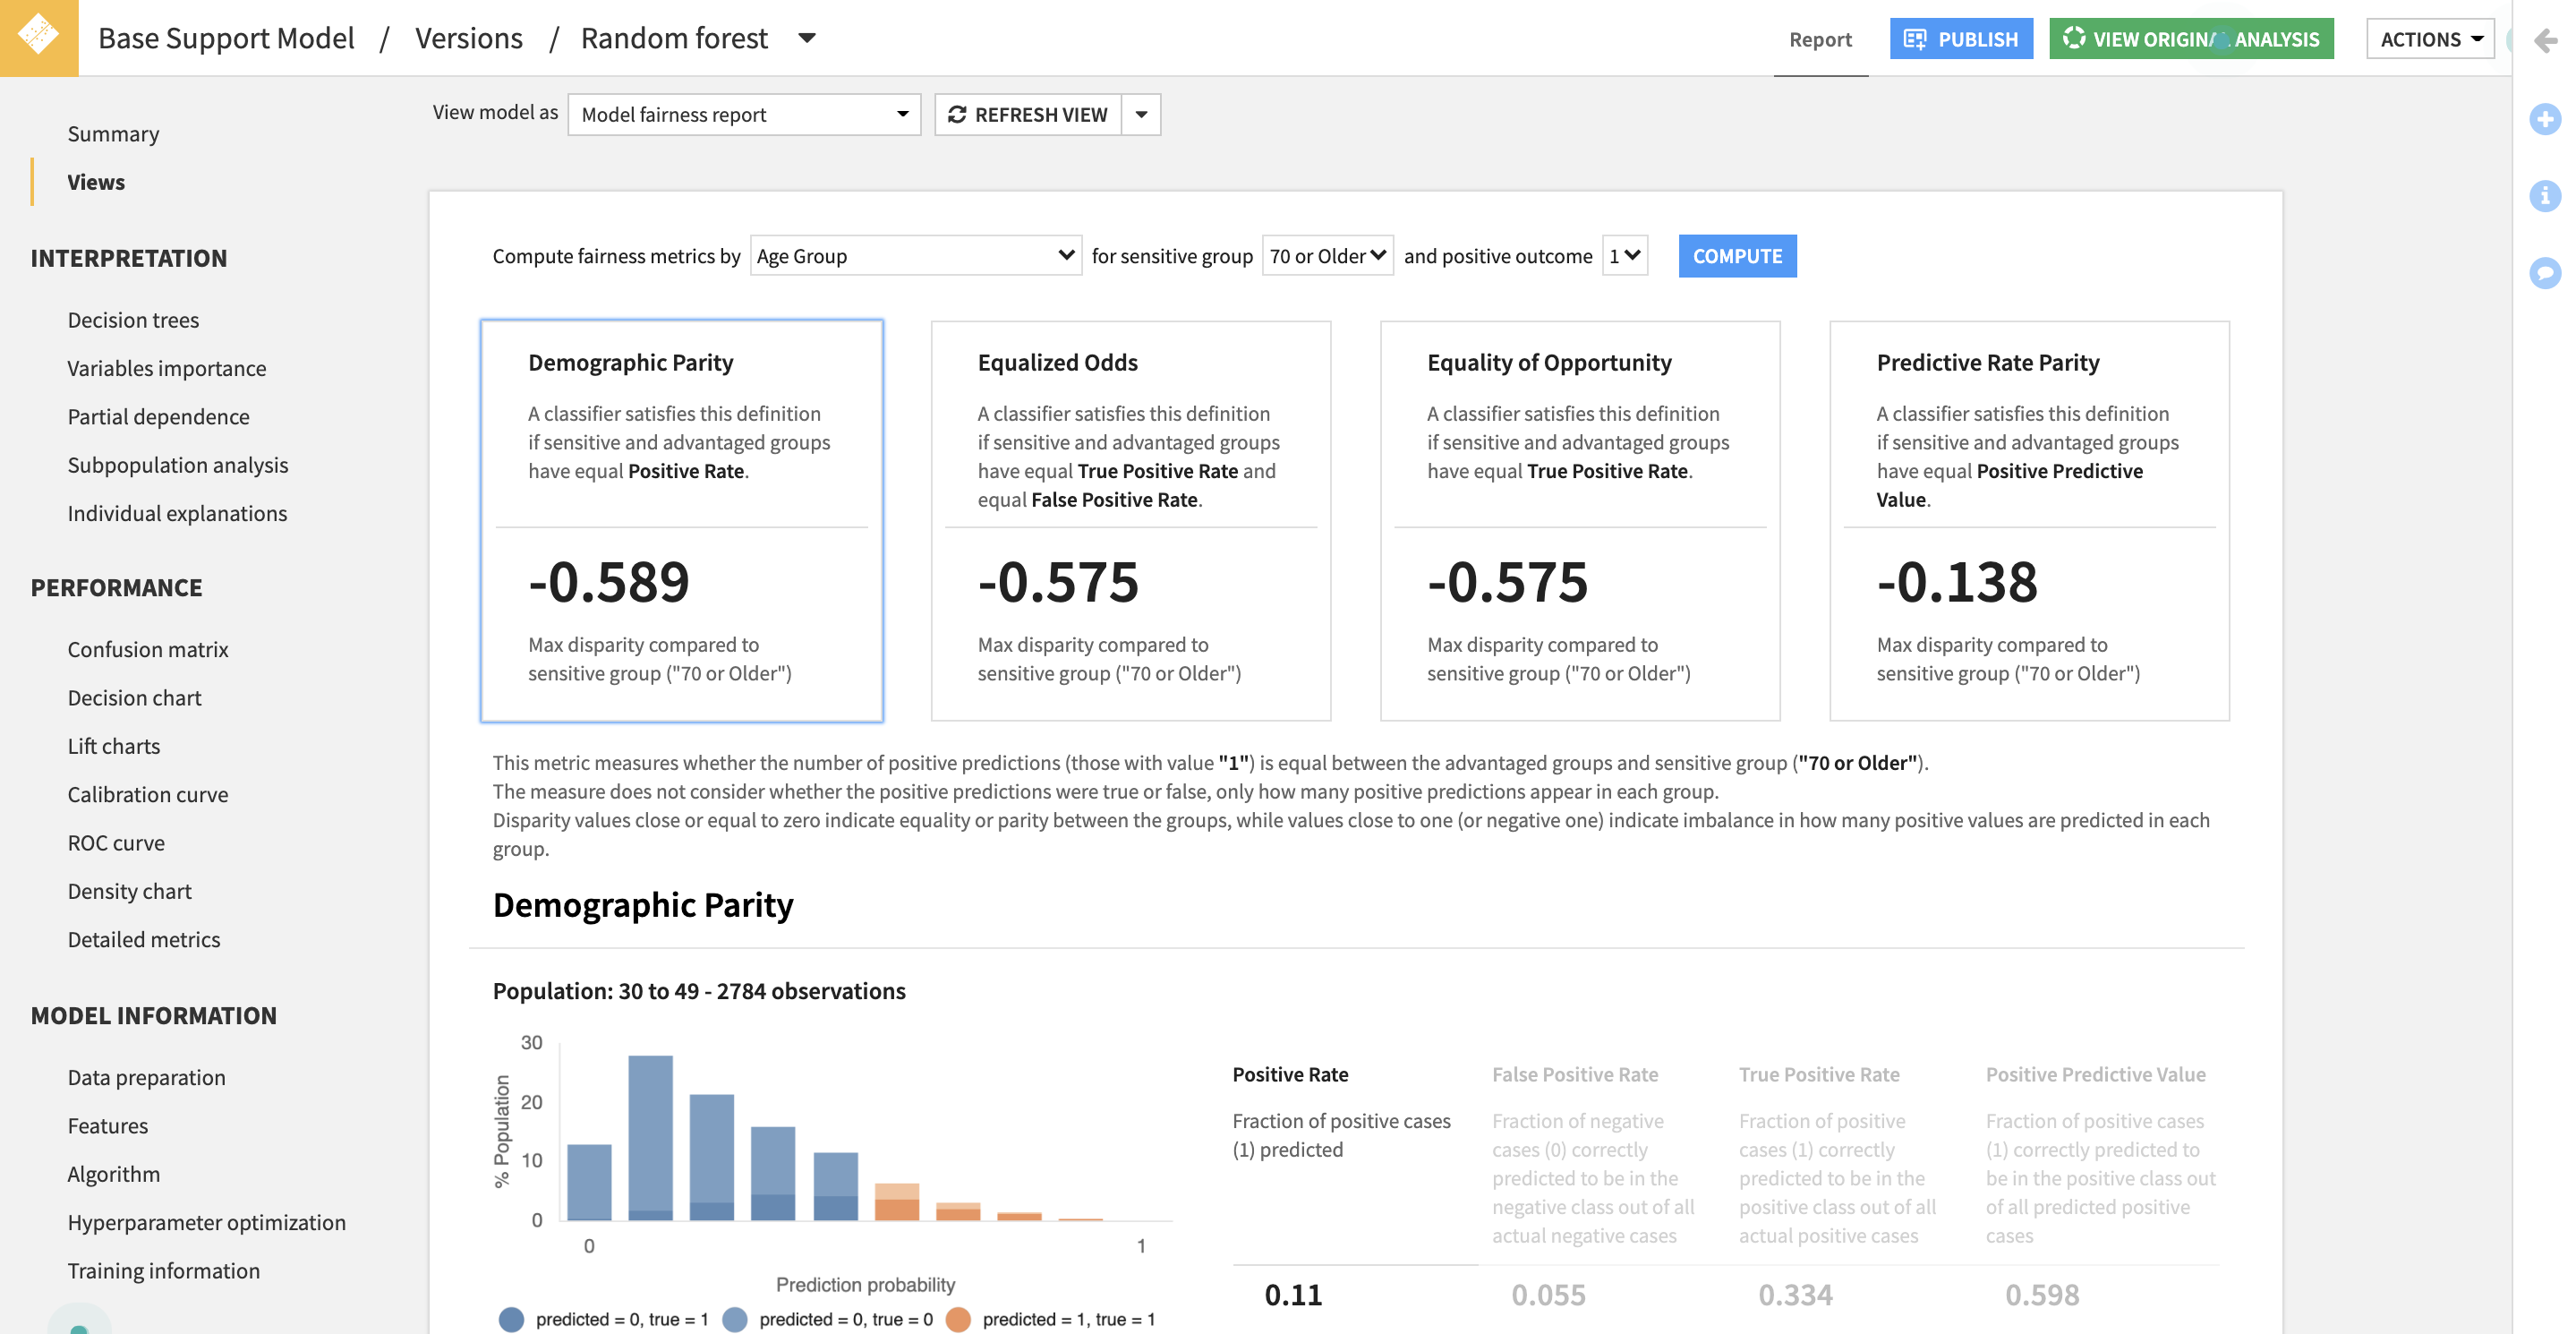
Four different metrics will be computed. Here for illustration purposes we suppose that we are in a loan assessment use case:
- Demographic Parity: people across groups have the same chance of getting the loan.
- Equalized Odds:
- Among people who will not default, they have the same chance of getting the loan.
- Among people who will default, they have the same chance of being rejected.
- Equality of Opportunity: among all people who will not default, they have the same chance of getting the loan.
- Predictive Rate Parity: among all people who are given the loan, across groups there is the same portion of people who will not default (equal chance of success given acceptance).