


Plugin information
| Version | 1.3.4 (DSS13), 1.3.2 (DSS12) |
|---|---|
| Author | Dataiku (Agathe Guillemot and Simona Maggio) |
| Released | 2021-05-31 |
| Last updated | 2025-02-07 |
| License | Apache Software License |
| Source code | Github |
| Reporting issues | Github |
Description
After training a ML model, data scientists need to investigate the model failures to build intuition on the critical subpopulations on which the model is performing poorly. This analysis is essential in the iterative process of model design and feature engineering and is usually performed manually.
The Model Error Analysis plugin provides the user with automatic tools to break down the model’s errors into meaningful groups, easier to analyse, and to highlight the most frequent type of errors, as well as the problematic characteristics correlated with the errors.
The plugin leverages the mealy package, which is developed and maintained by Dataiku’s research team.
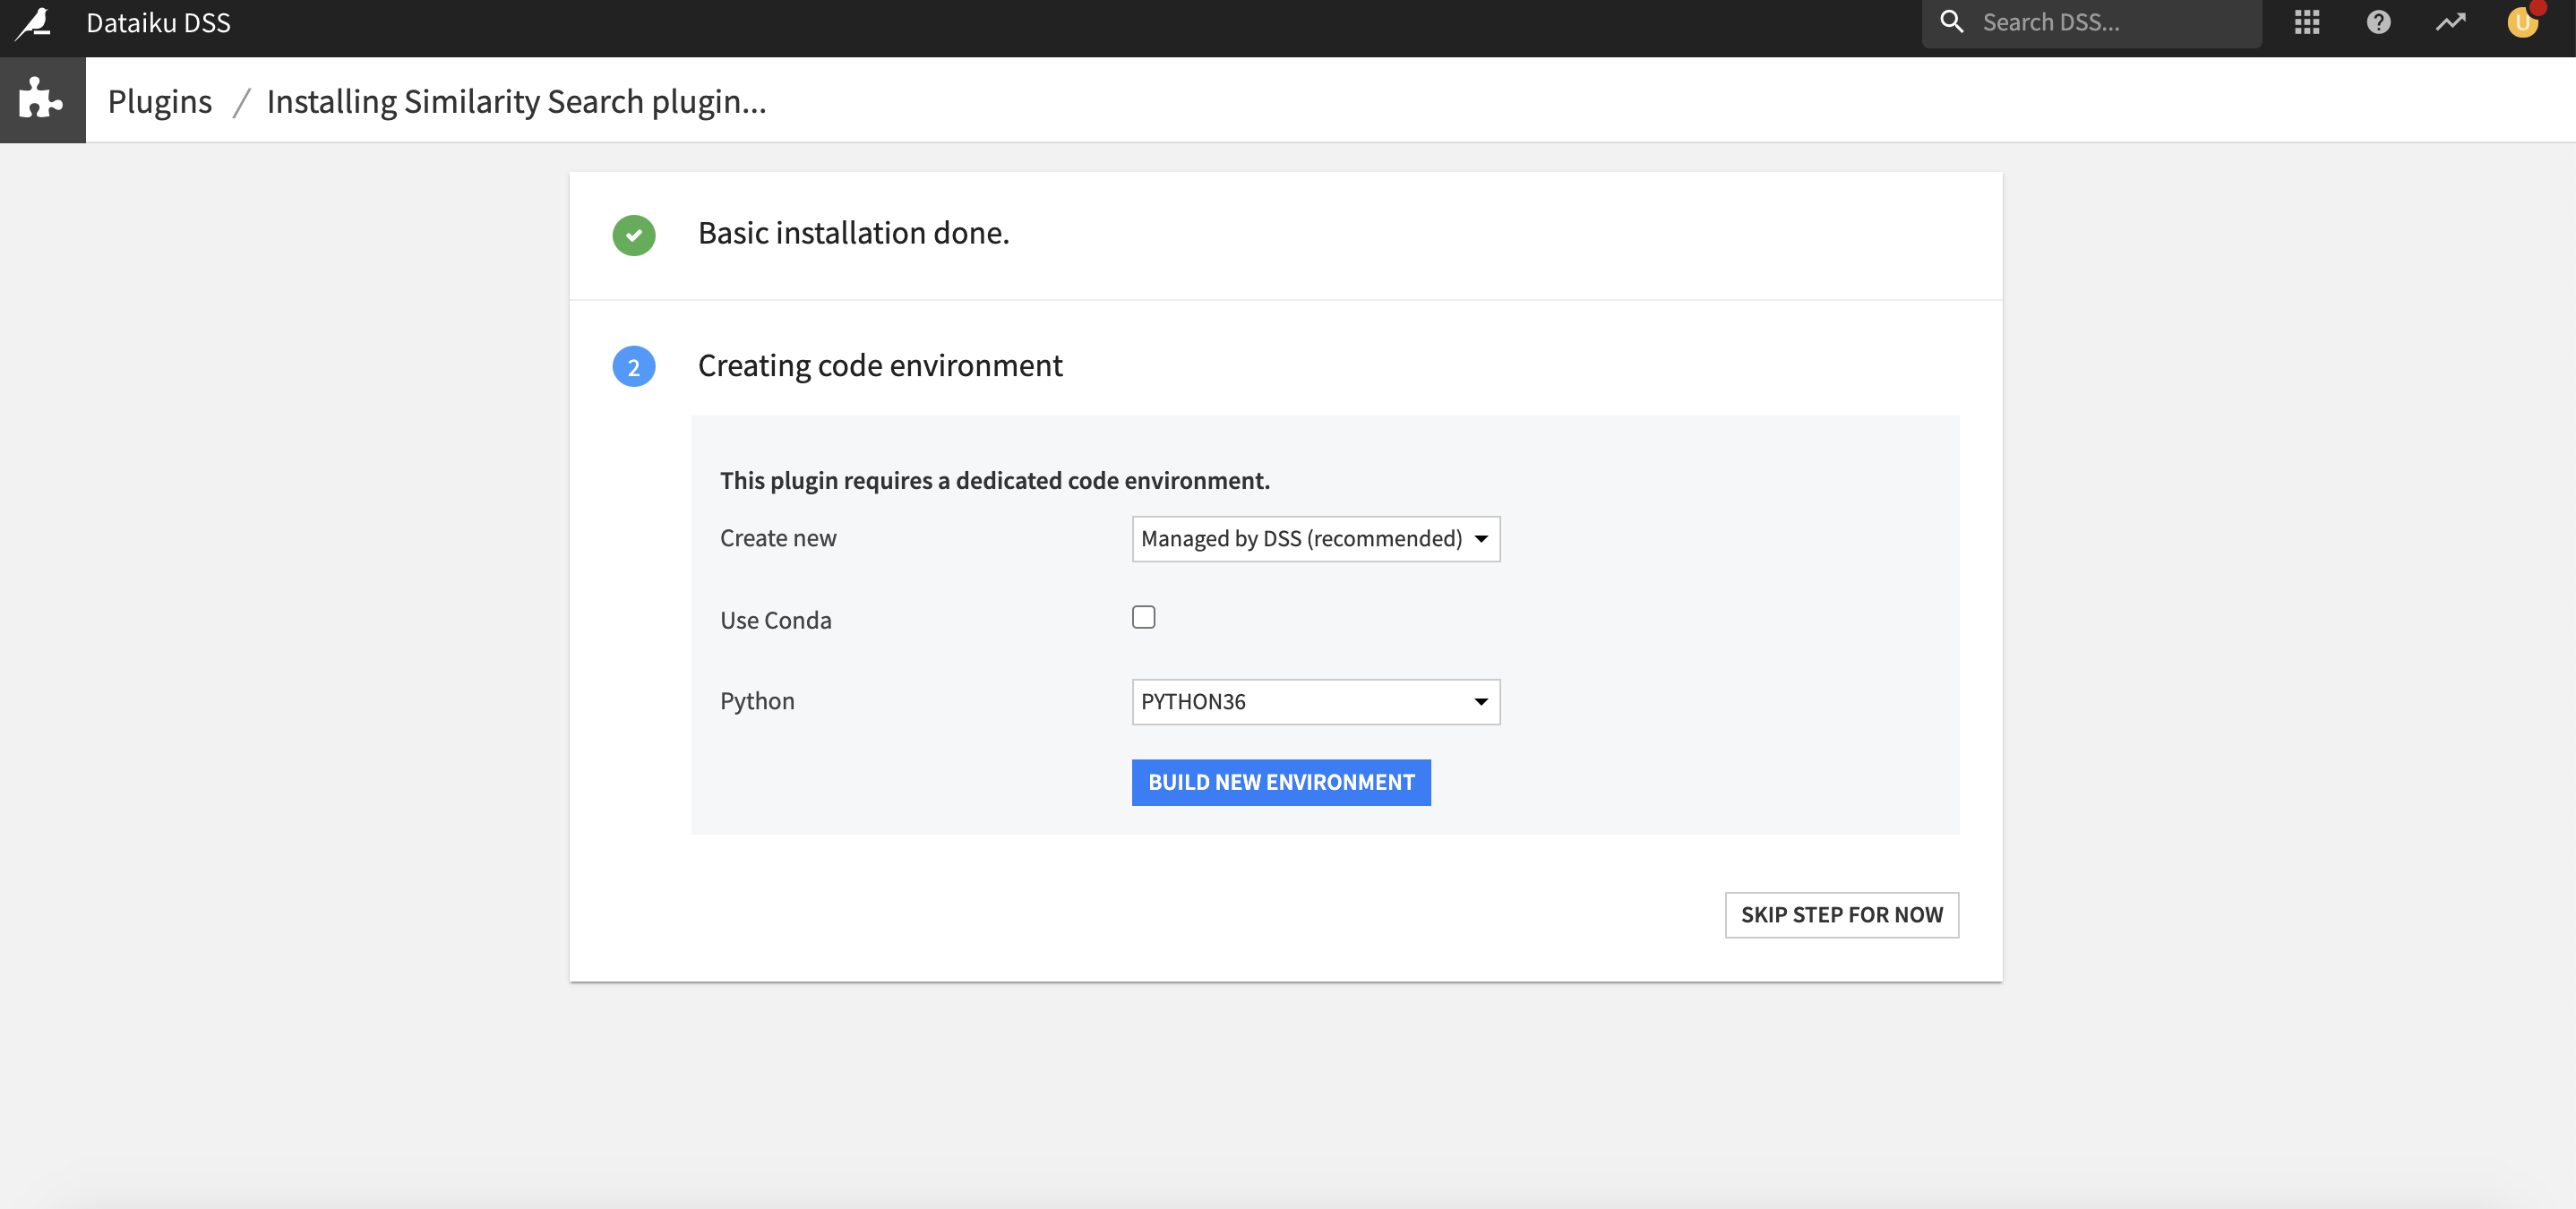
Setup
Right after installing the plugin, you may build its code environment, for python 3.6 up to 3.11. Since version 1.2.0 of the plugin, creating the code environment is not necessary to use the model view, i.e. to use it from the model’s result page (Model Error Analysis tab). The model view uses the code env with which the model was trained, the plugin code env is only required to using the plugin’s notebook template.
Principle
Model Error Analysis streamlines the analysis of the samples mostly contributing to the model’s mistakes. We call the model under investigation the original model.
This approach relies on an Error Tree, a secondary model trained to predict whether the primary model prediction is correct or wrong, i.e. a success or a failure. More precisely, the Error Tree is a binary Decision Tree classifier predicting whether the primary model will yield a Correct Prediction or an Incorrect Prediction.
The Model Error Analysis plugin automatically highlights any information relevant to the model’s errors, helping the user to focus on what are the problematic features, and what are the typical values of these features for the incorrectly predicted samples. This information can later be exploited to support the strategy selected by the user :
- Improve model design: removing a problematic feature, removing samples likely to be mislabeled, ensemble with a model trained on a problematic subpopulation, …
- Enhance data collection: gather more data regarding the most erroneous or under-represented populations,
- Select critical samples for manual inspection thanks to the Error Tree, and avoid primary predictions on them, generating model assertions.
How to use
Model views: Model Error Analysis
Reminder: A model view is an additional way to visualize information about a model. Model views appear as extra tabs in a model’s result page (either in an analysis in the Lab before the model is deployed, or in a saved model version once the model is deployed to the Flow).
General metrics
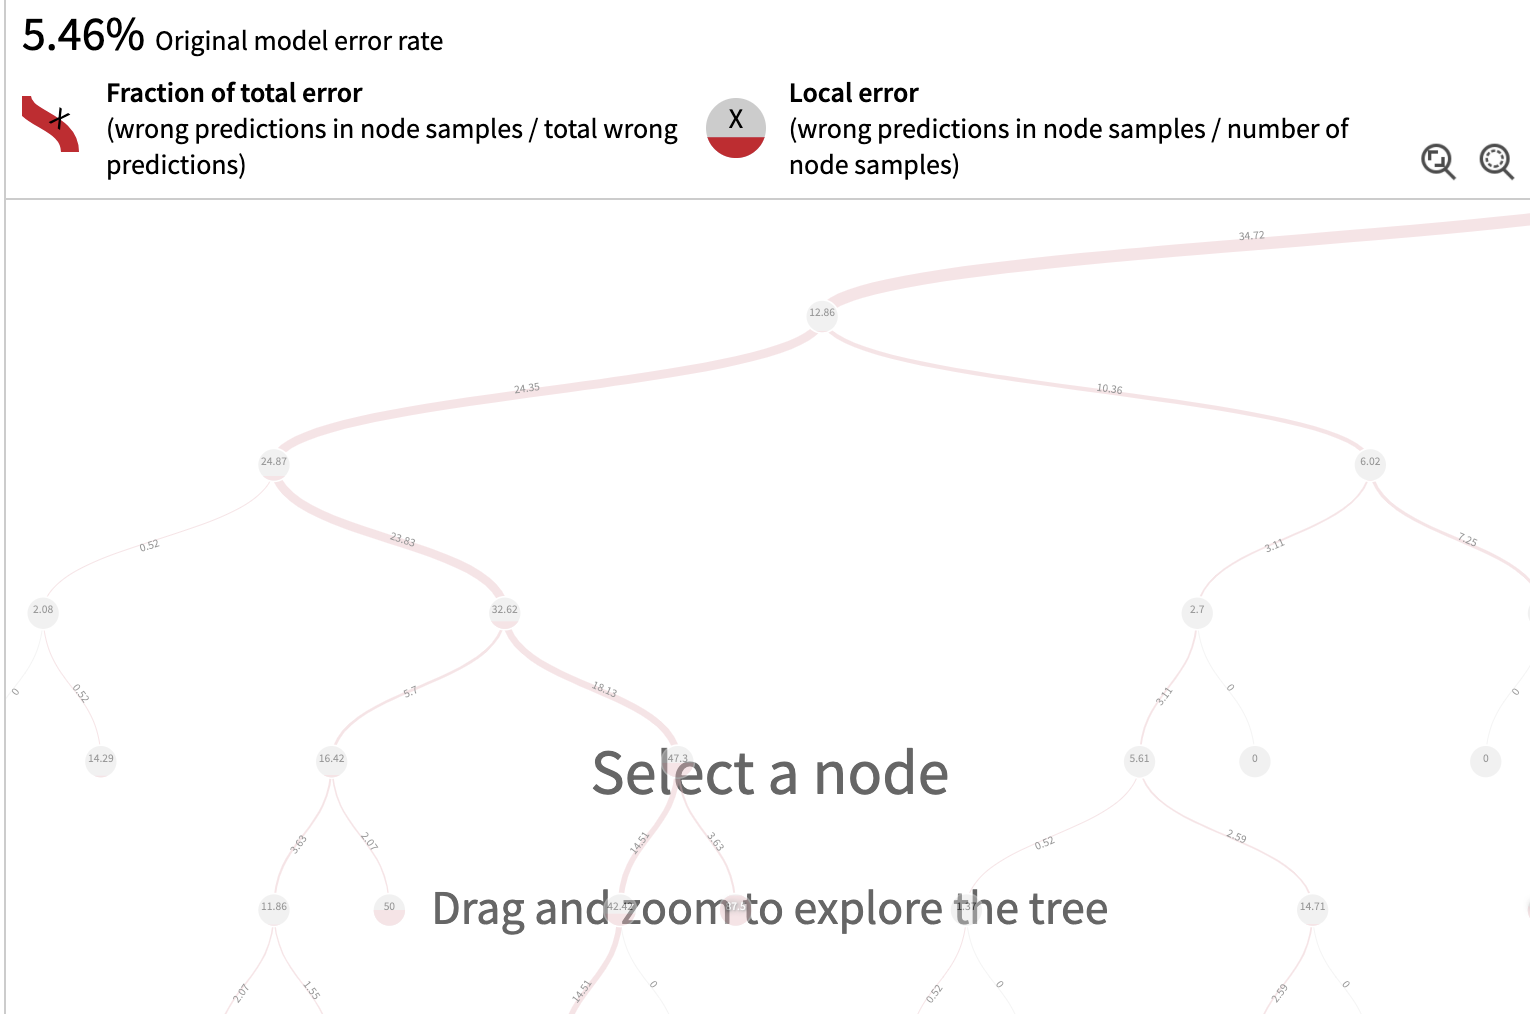
The top panel highlights the main metrics:
- Original model error rate: proportion of samples in the test set the primary model predicts incorrectly.
- Fraction of total error: incorrect predictions present in a selected node over the total number of incorrect predictions in the whole population.
- Local error: incorrect predictions in a selected node over the number of samples in the node.
The tree and its nodes
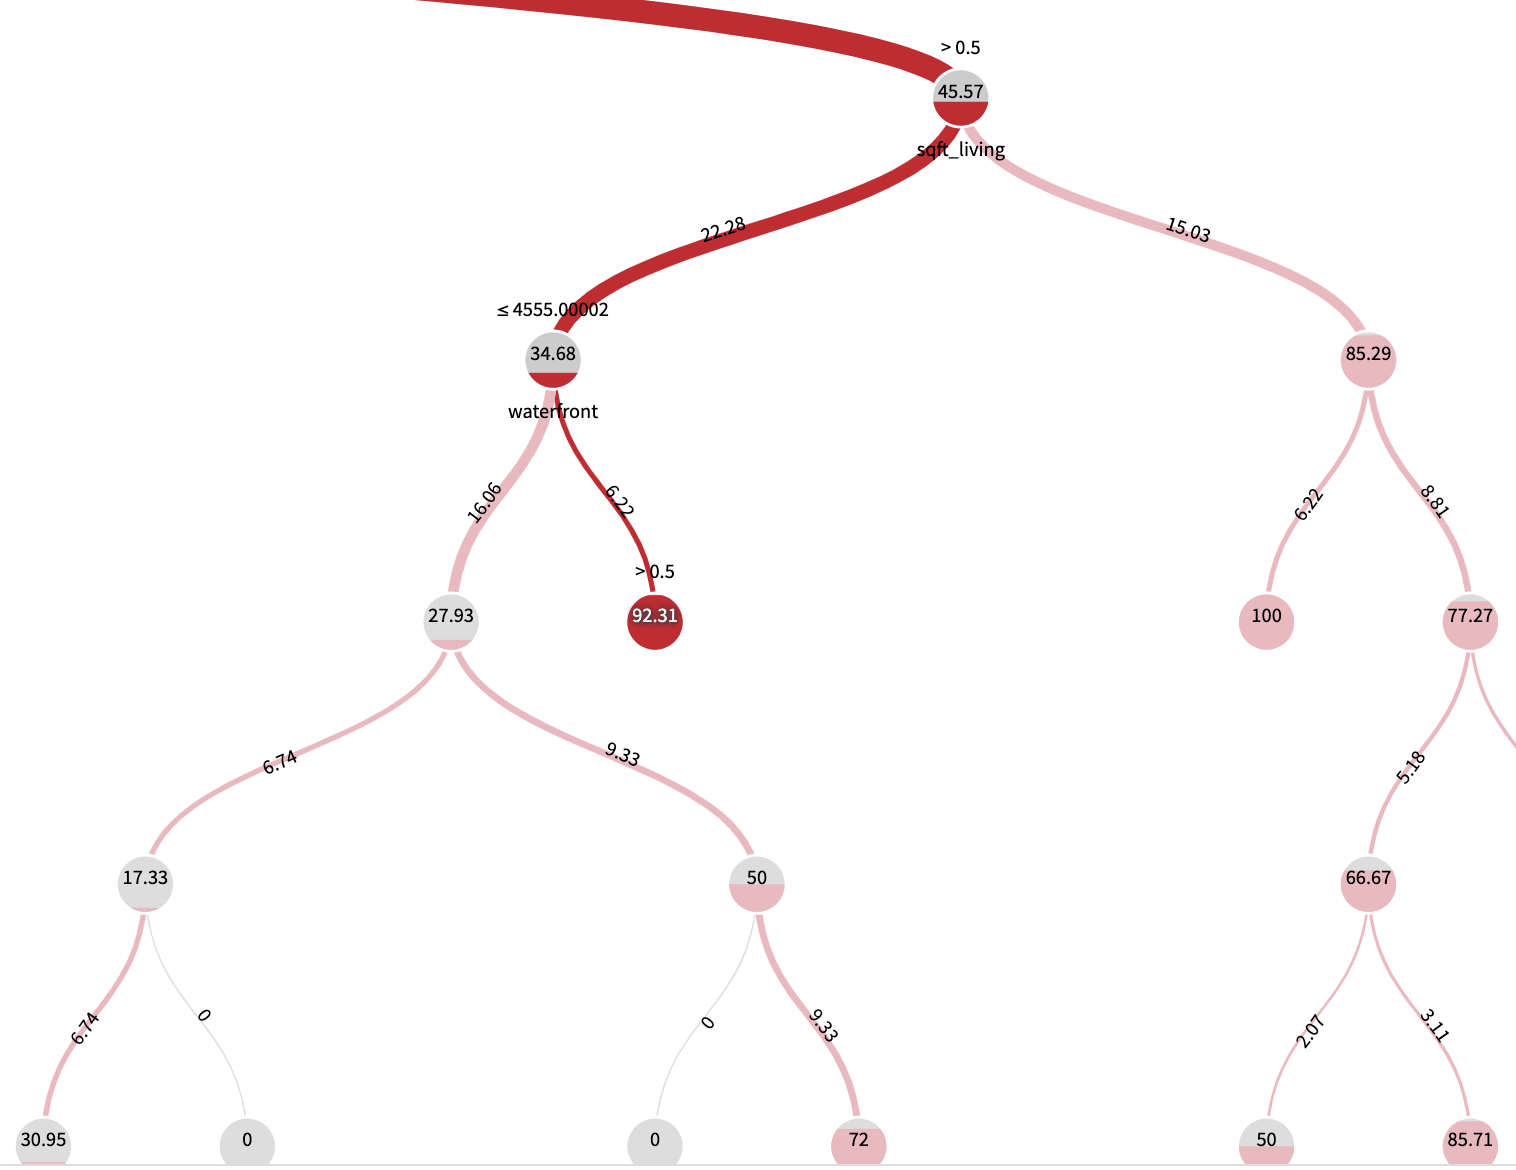
The fraction of total error is represented in the width of the tree branches and draws a path driving towards the nodes containing the majority of errors
The local error is represented with the level of red in a node, and it’s the error rate of the population of the node
The interesting nodes are the one containing the majority of errors (thickest branches), and possibly with the highest local error rates (highest red levels, especially higher than the original model error rate).
Left panel node analysis
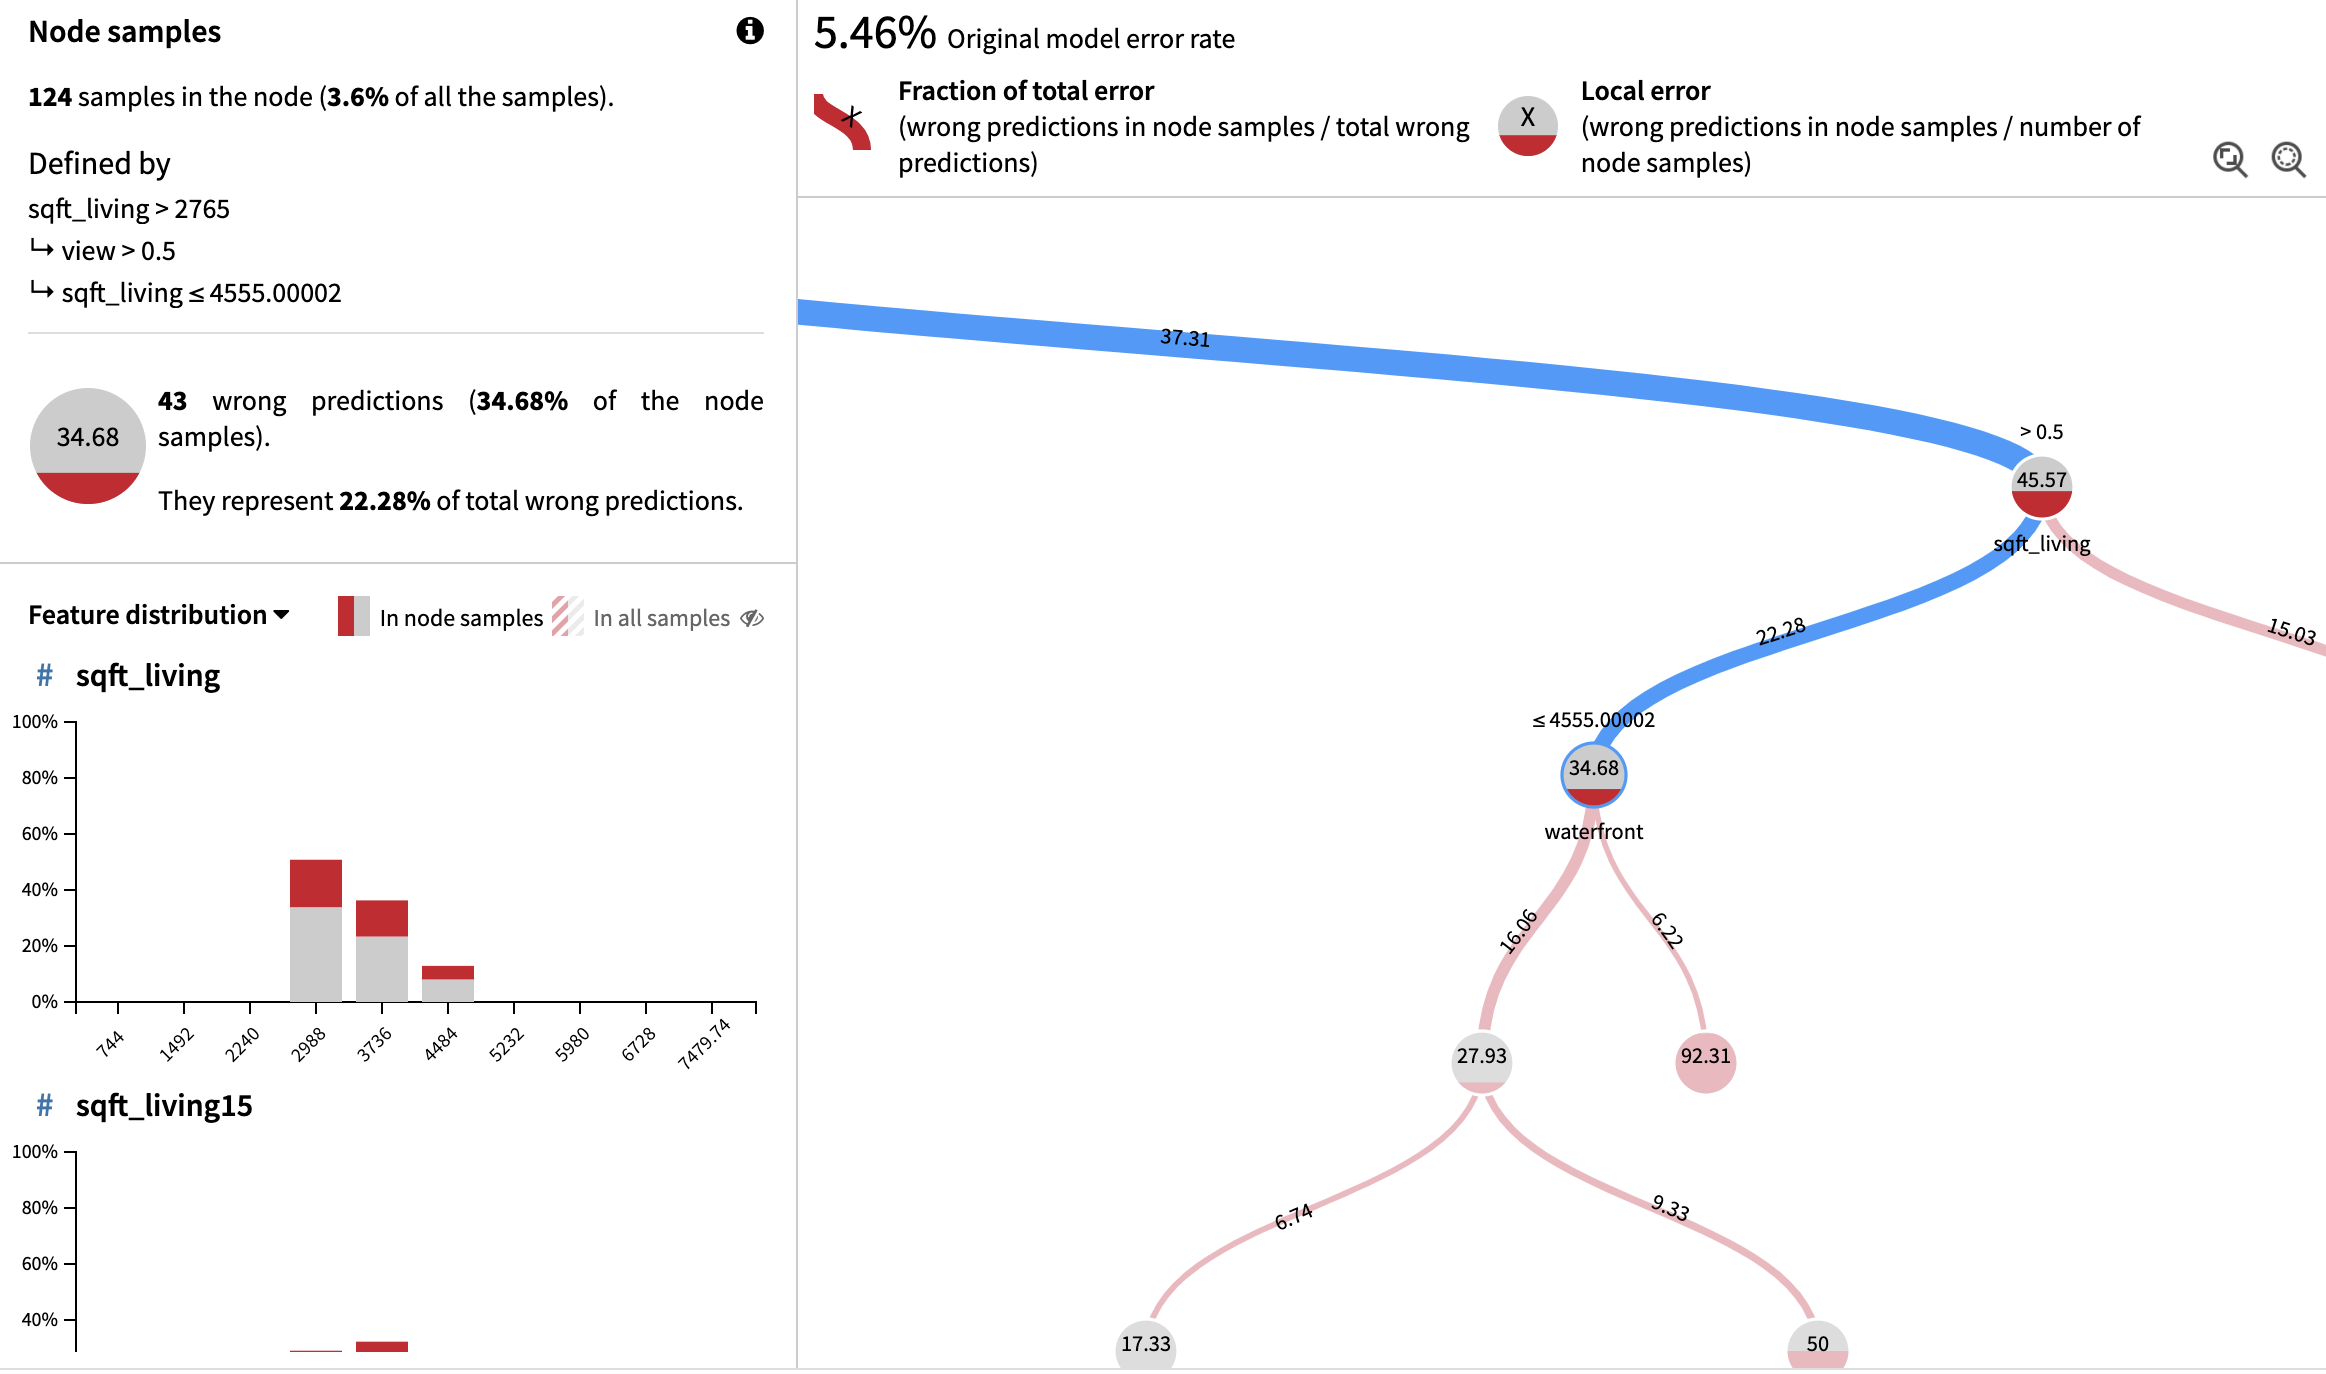
When clicking on a node, a panel will appear on the left with several pieces of information:
- Sample: number and overall proportion of samples in the node.
- Decision rule section: specifies the decision path to reach the chosen node (column_A < x and column_B > y, etc.).
- Fraction of total error: the ratio between the number of errors in this node and the total number of errors.
- Local error: error rate in the node, again represented as a red level in a circle.
The Decision rule section allows the user to know at a glance the segment of data represented by the node.
The Univariate histogram section:
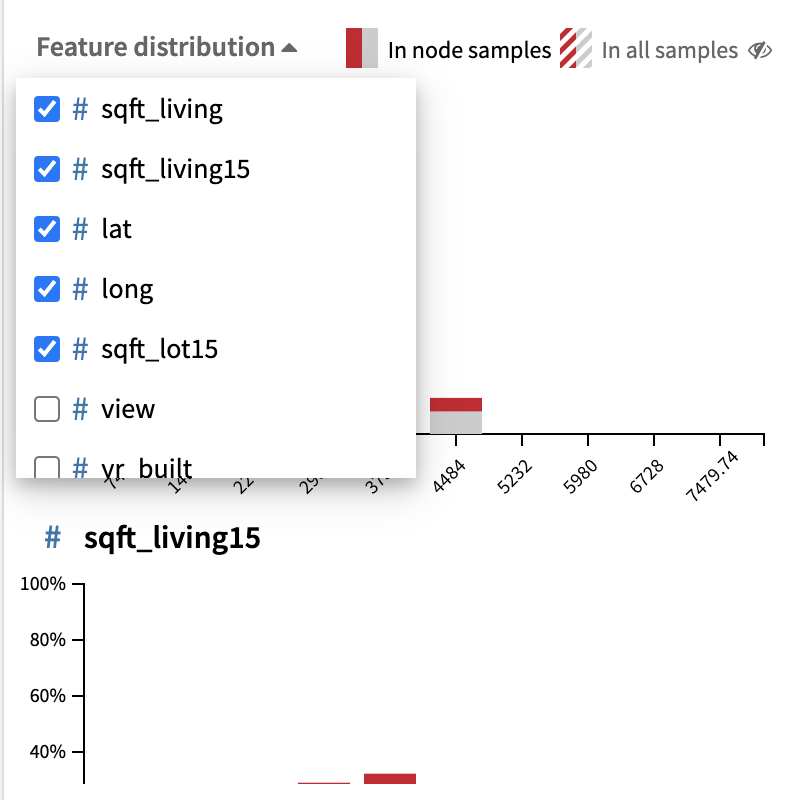
- The top-5 features most correlated with the errors are displayed from top to bottom
- More features can be selected in the drop down menu.
- For each feature, we can compare its distribution in the node to its distribution in the whole test set thanks to the ‘in all samples’ toggle.
- For each bin, we show the percentage of correct/incorrect predictions.
- Looking at the discrepancy between the two distributions allows the user to see
- Which features are the source of the problem.
- Which feature values characterise the erroneous samples.
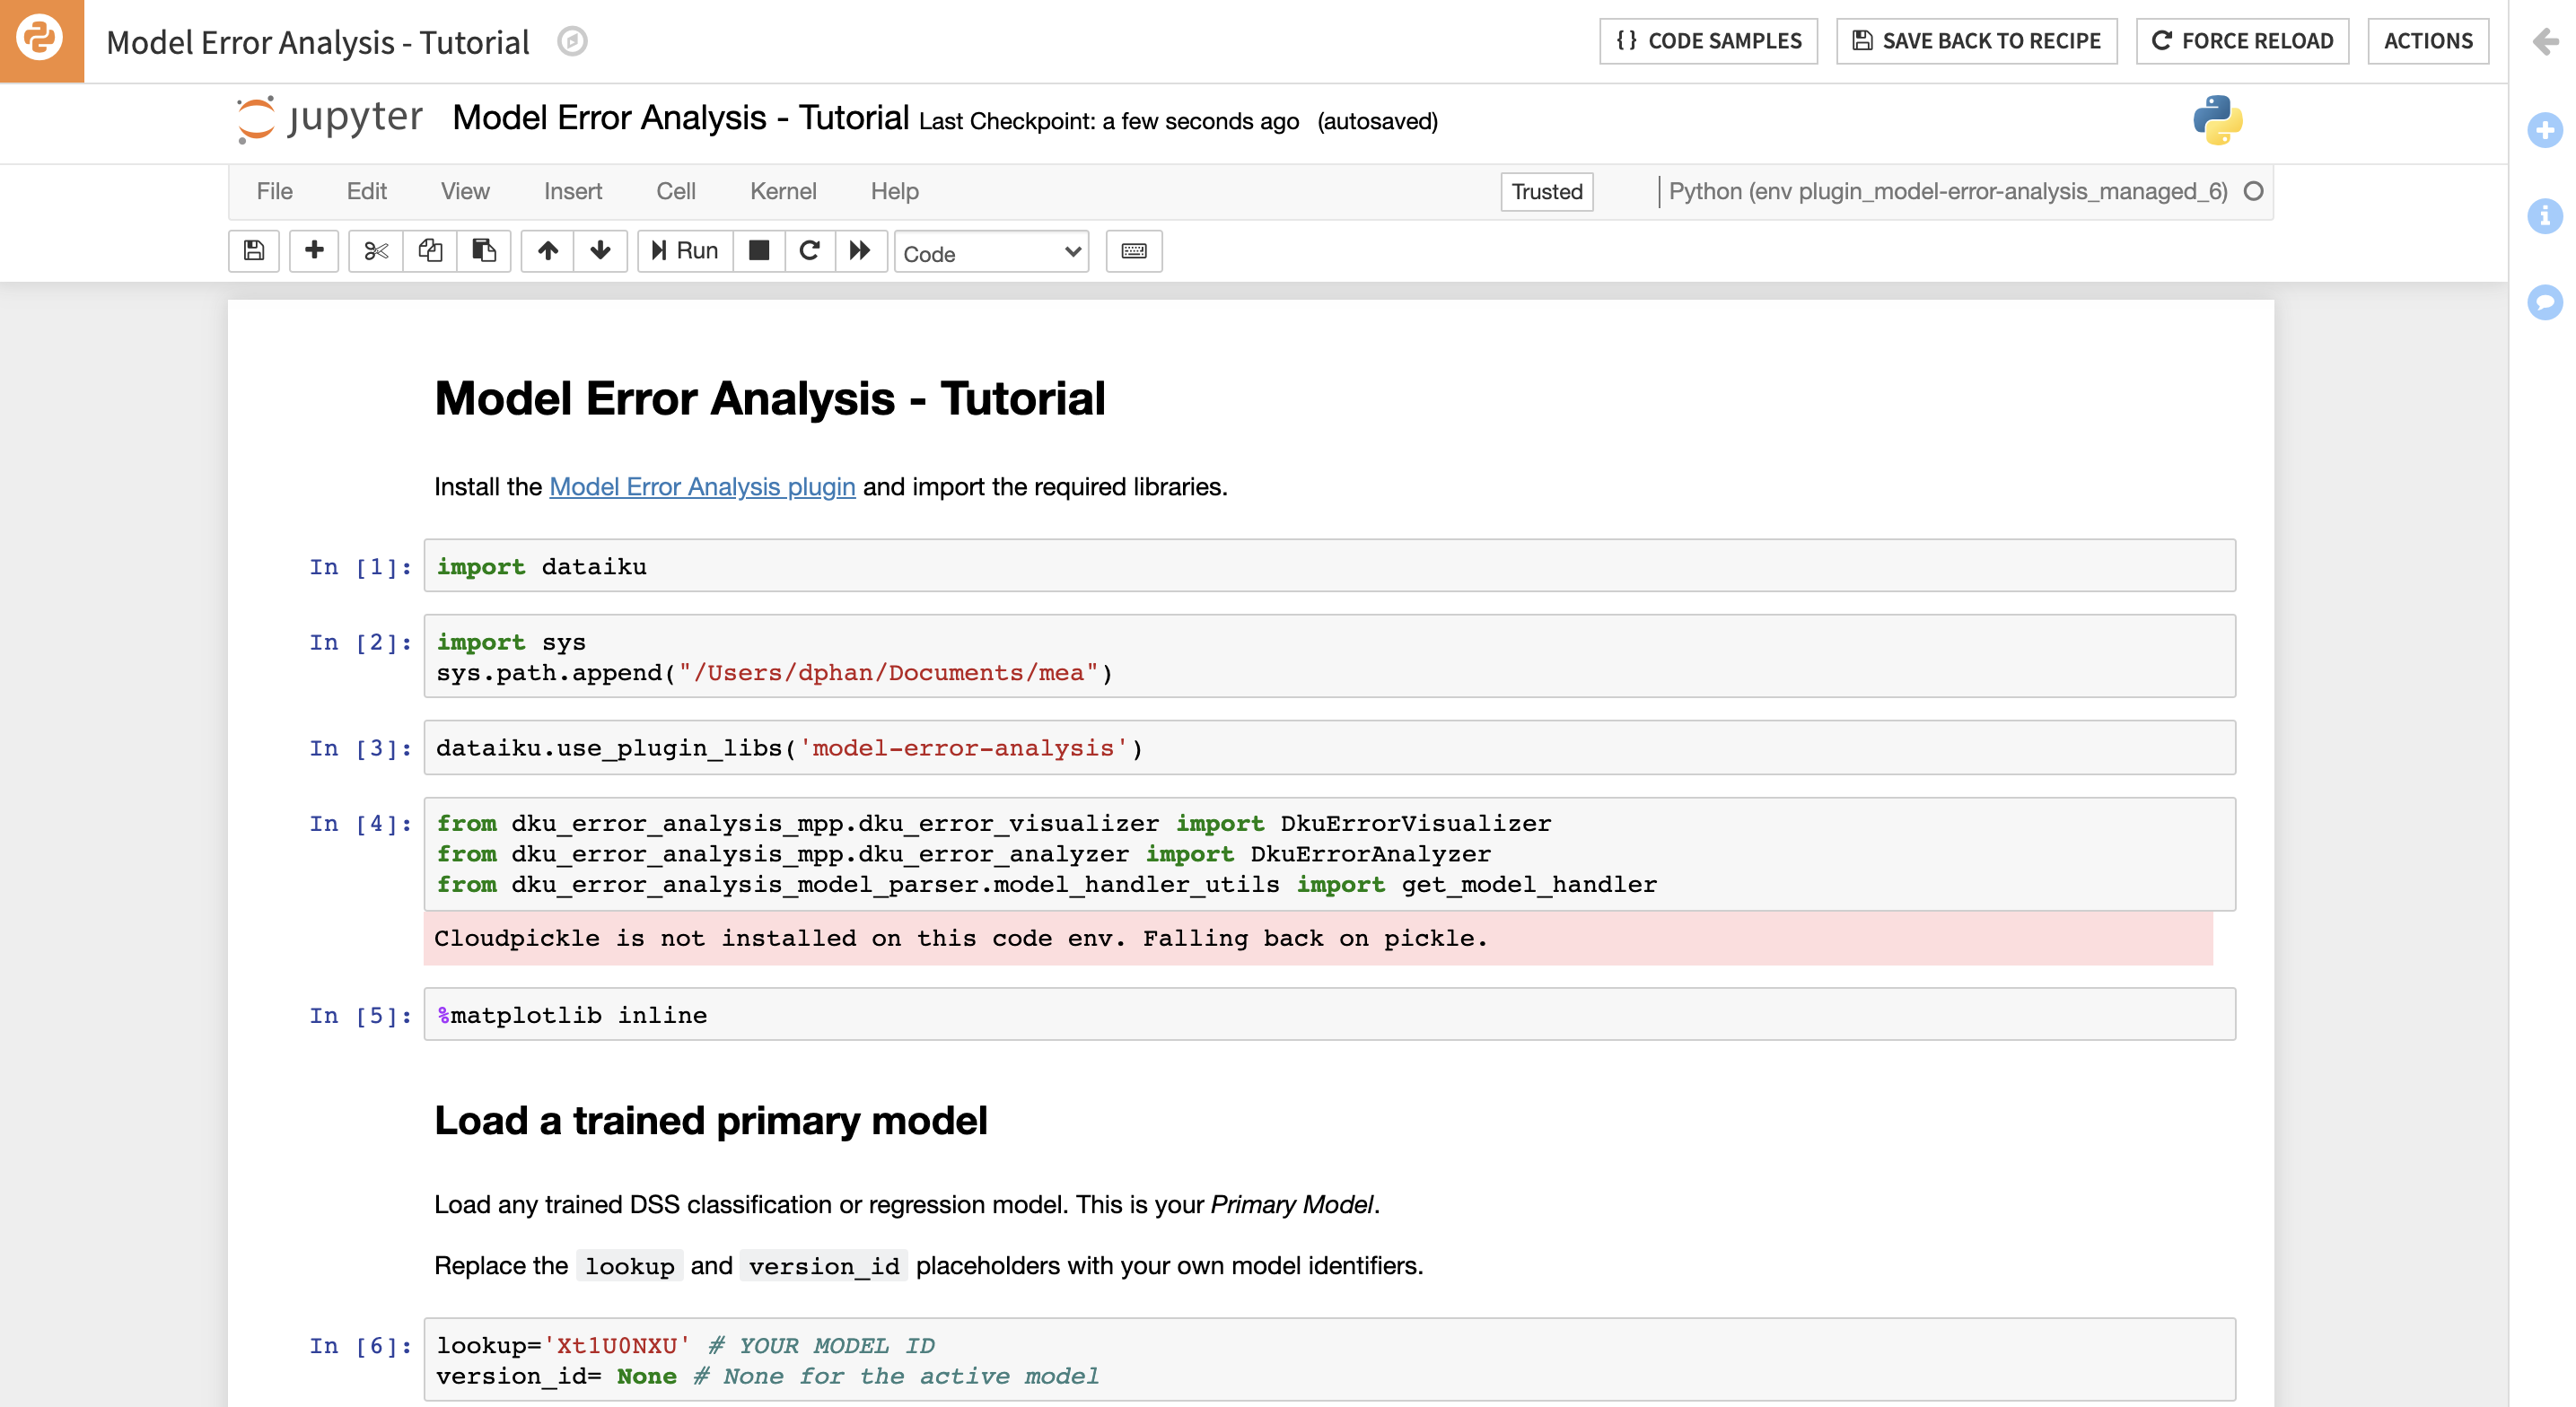
Template notebook: Model Error Analysis tutorial
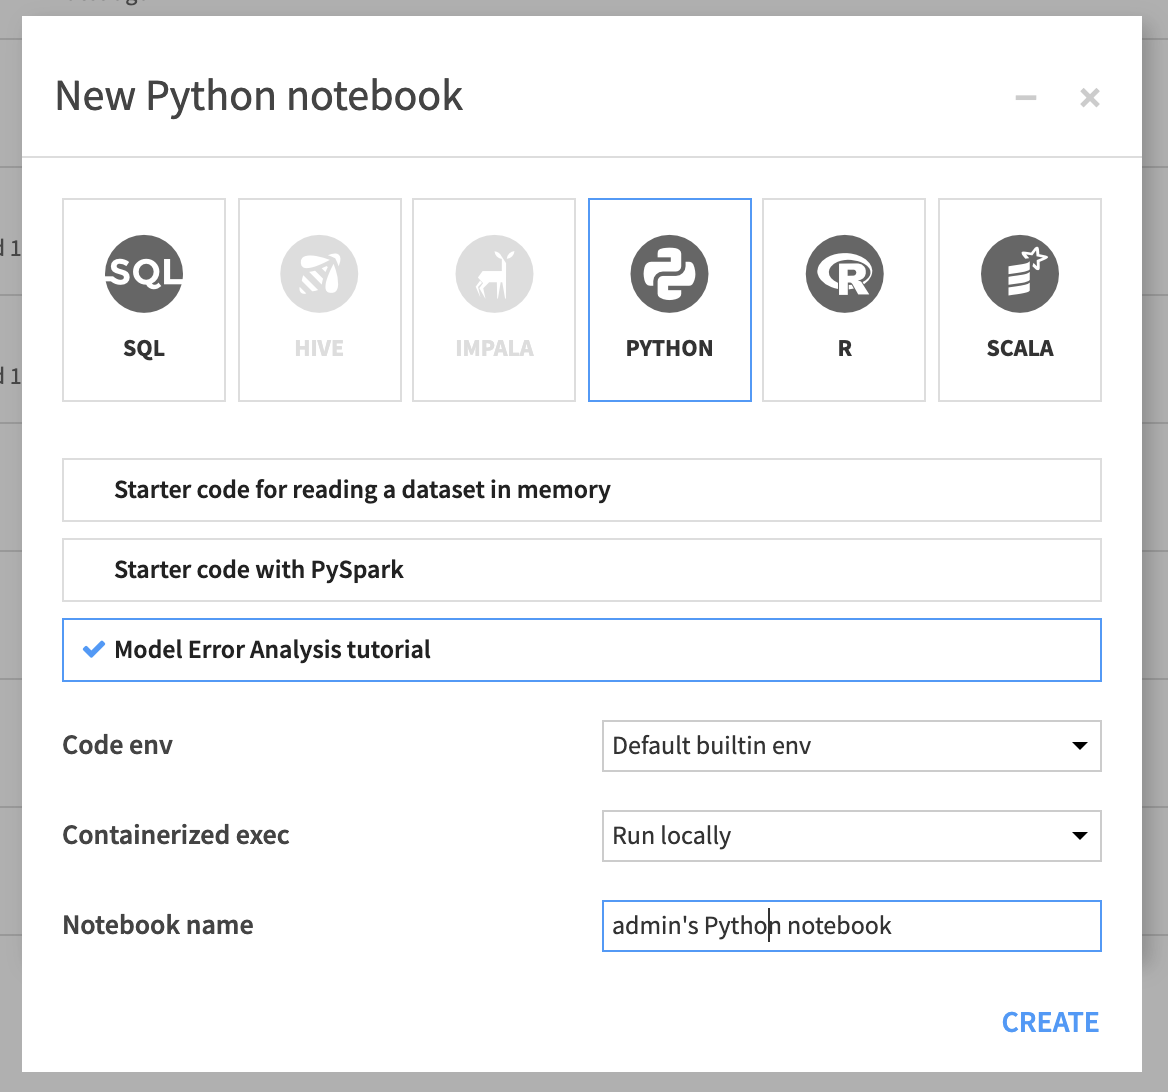
For coders who want to go further in their analysis, a python library is provided. It can be used with a visual DSS model or a custom scikit model.
The plugin comes with a python template notebook that can serve as a tutorial to help users understands how the python library works. You should use the code env from the plugin in this notebook.