

Plugin information
| Version | 1.0.3 |
|---|---|
| Author | Dataiku (Romain Menini) |
| Released | 2022-08-01 |
| Last updated | 2024-02-13 |
| License | Apache Software License |
| Source code | Github |
| Reporting issues | Github |
Description
This plugin allows you to :
- Convert electricity consumption into co2 emission based on the carbon intensity of the location and date
- Retrieve energy mix from a given location
- Retrieve the forecasted carbon intensity
Data providers
This plugin is mainly based on data from Electricity Maps, a paid data provider. You’ll need to request an API token using the contact form. Before that, ensure the location you want to retrieve the carbon intensity from is covered on the Electricity Maps app.
You can also convert electricity consumption into co2 emissions for free by using RTE, but it only covers France.
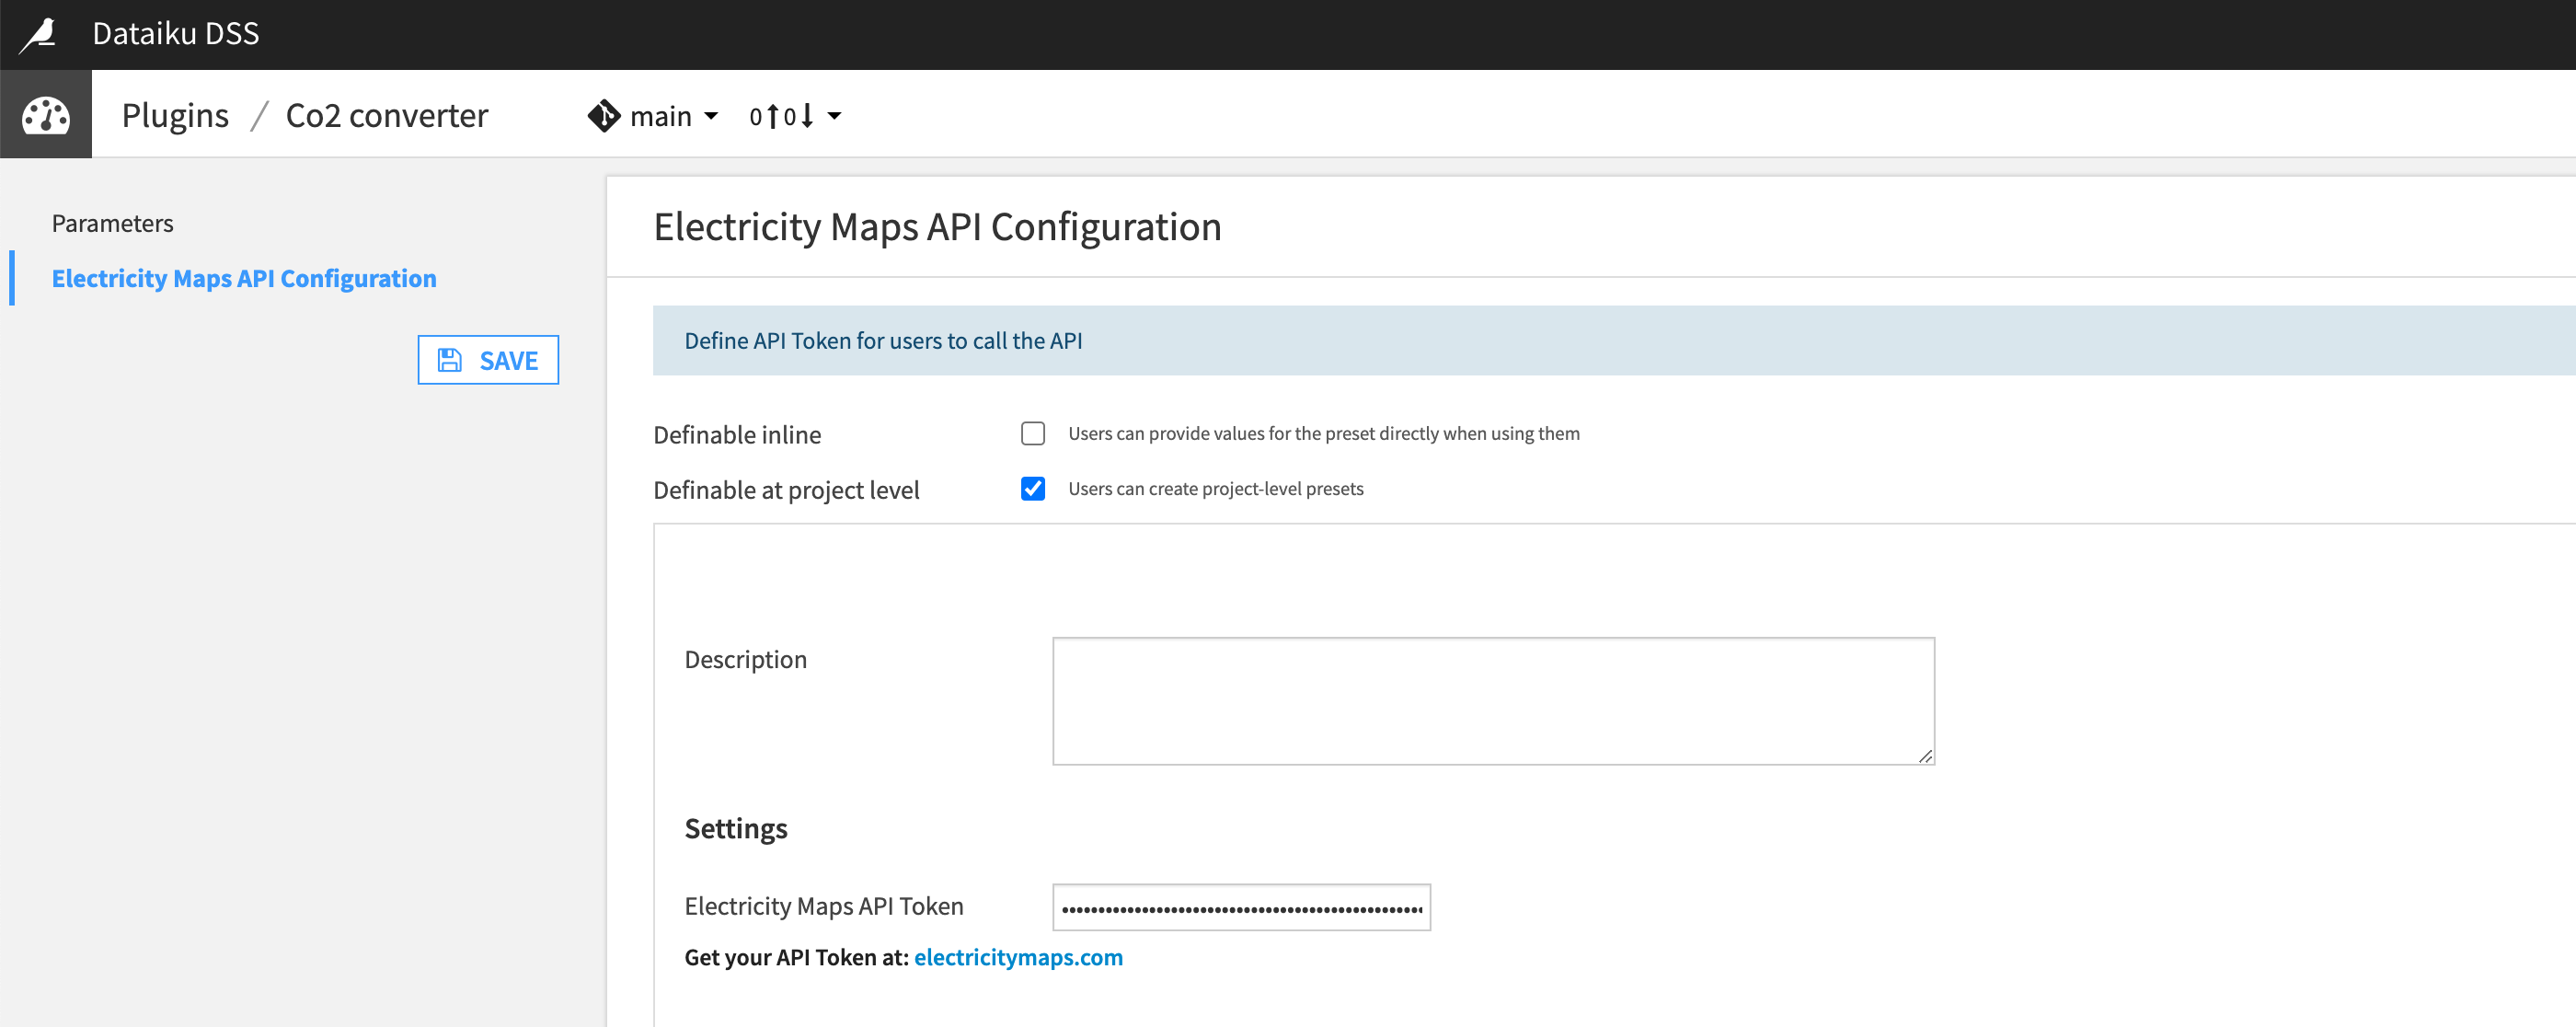
Setup
Once the plugin is installed from the store, if using Electricity Maps, to set your token, go to Plugin > CO2 Converter > Settings > Electricity Maps API Configuration > + Add preset.
How to use
Electricity to CO2 emissions conversion:
This component adds a recipe to the flow in which you need to specify a Date column and an electricity consumption column:
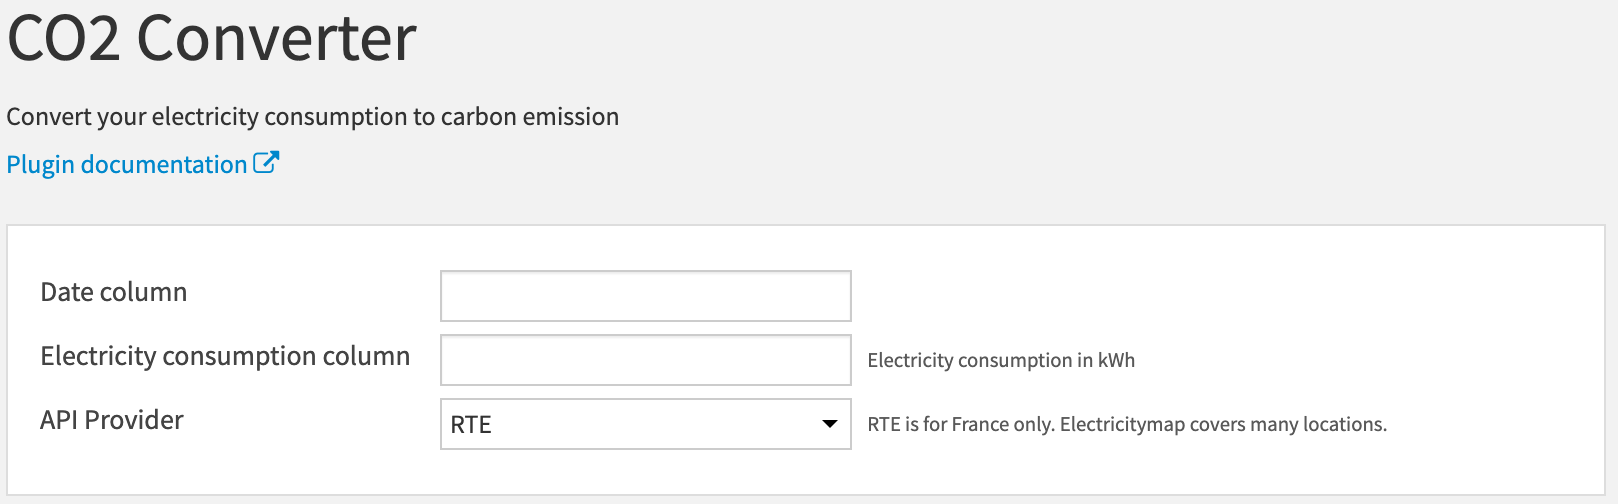
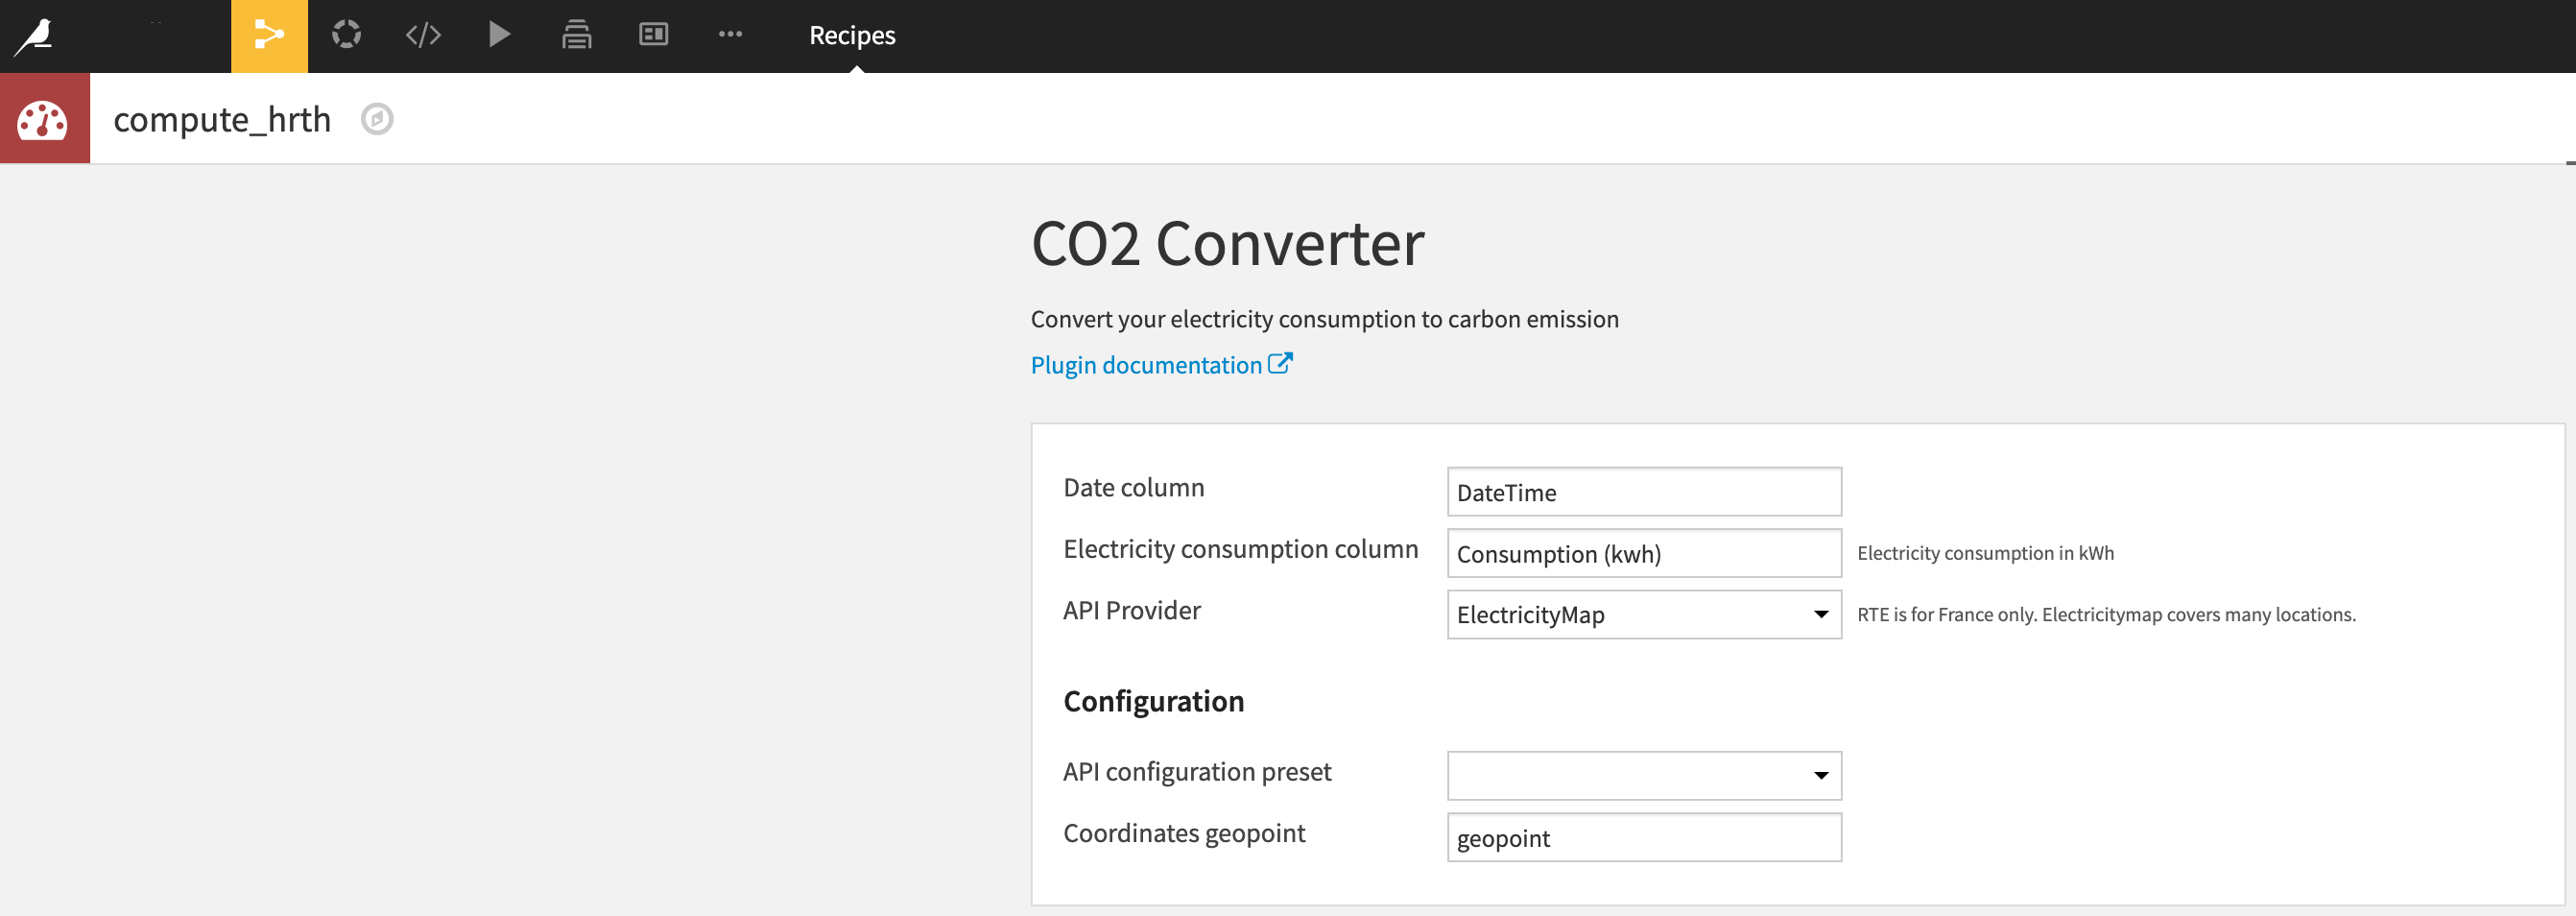
By default, the API provider is RTE. Once set up, the plugin automatically queries the API based on the date range from the input dataset, to avoid making too many requests. Also, due to electricity Maps API limitations, it creates chunks of 10 days for this data provider.
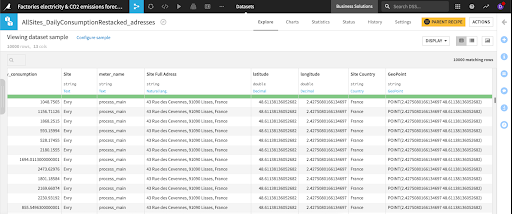
Since electricity maps requires a geopoint column, it allows multiple locations in the same input dataset. If you are using Electricity Maps, you will need to use a previously configured plugin preset before specifying the geopoint columns of your dataset. If you have longitude and latitude columns, you can create a geopoint using the dedicated data preparation processor.
Finally, run the plugin recipe to retrieve the closest carbon intensity from your location. The recipe outputs a dataset that appends 3 new columns to the input dataset:
- co2_date_time (closest date available from the API provider. It may be interesting to use metrics & checks to check the difference between the requested and provided dates.)
- carbon_intensity (gCO₂eq/kWh)
- co2_emission (kgCO₂eq)
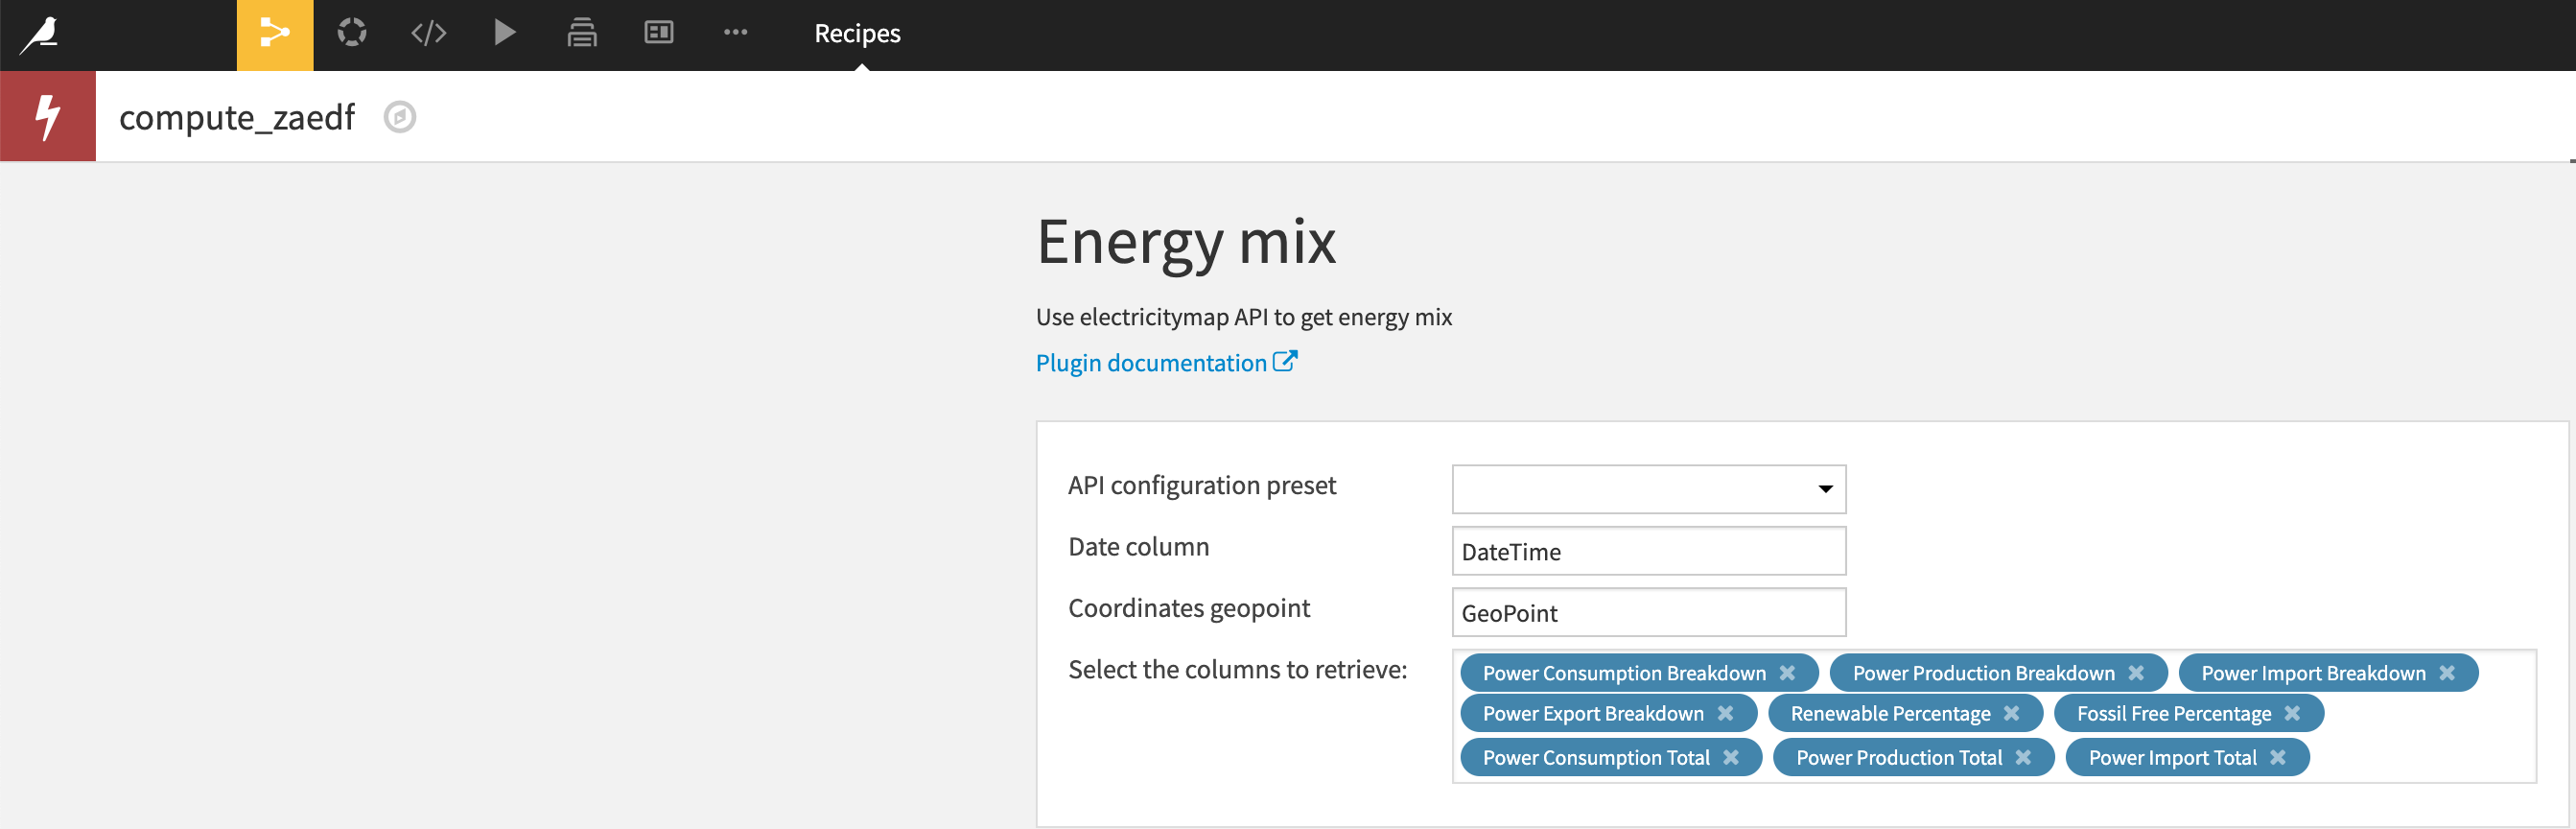
Retrieve energy mix:
This component adds a recipe to the flow in which you need to specify an Electricity Maps API preset, a Date column, and a geopoint column. Then, you can select the columns from the Electricity Maps API you want to retrieve, among:
- Power Consumption Breakdown
- Power Production Breakdown
- Power Import Breakdown
- Power Export Breakdown
- Renewable percentage
- Fossil-free Percentage
- Power Consumption Total
- Power Production Total
- Power Import Total
Once you run the recipe, your initial dataset will be enriched with the selected columns according to the location and date time.
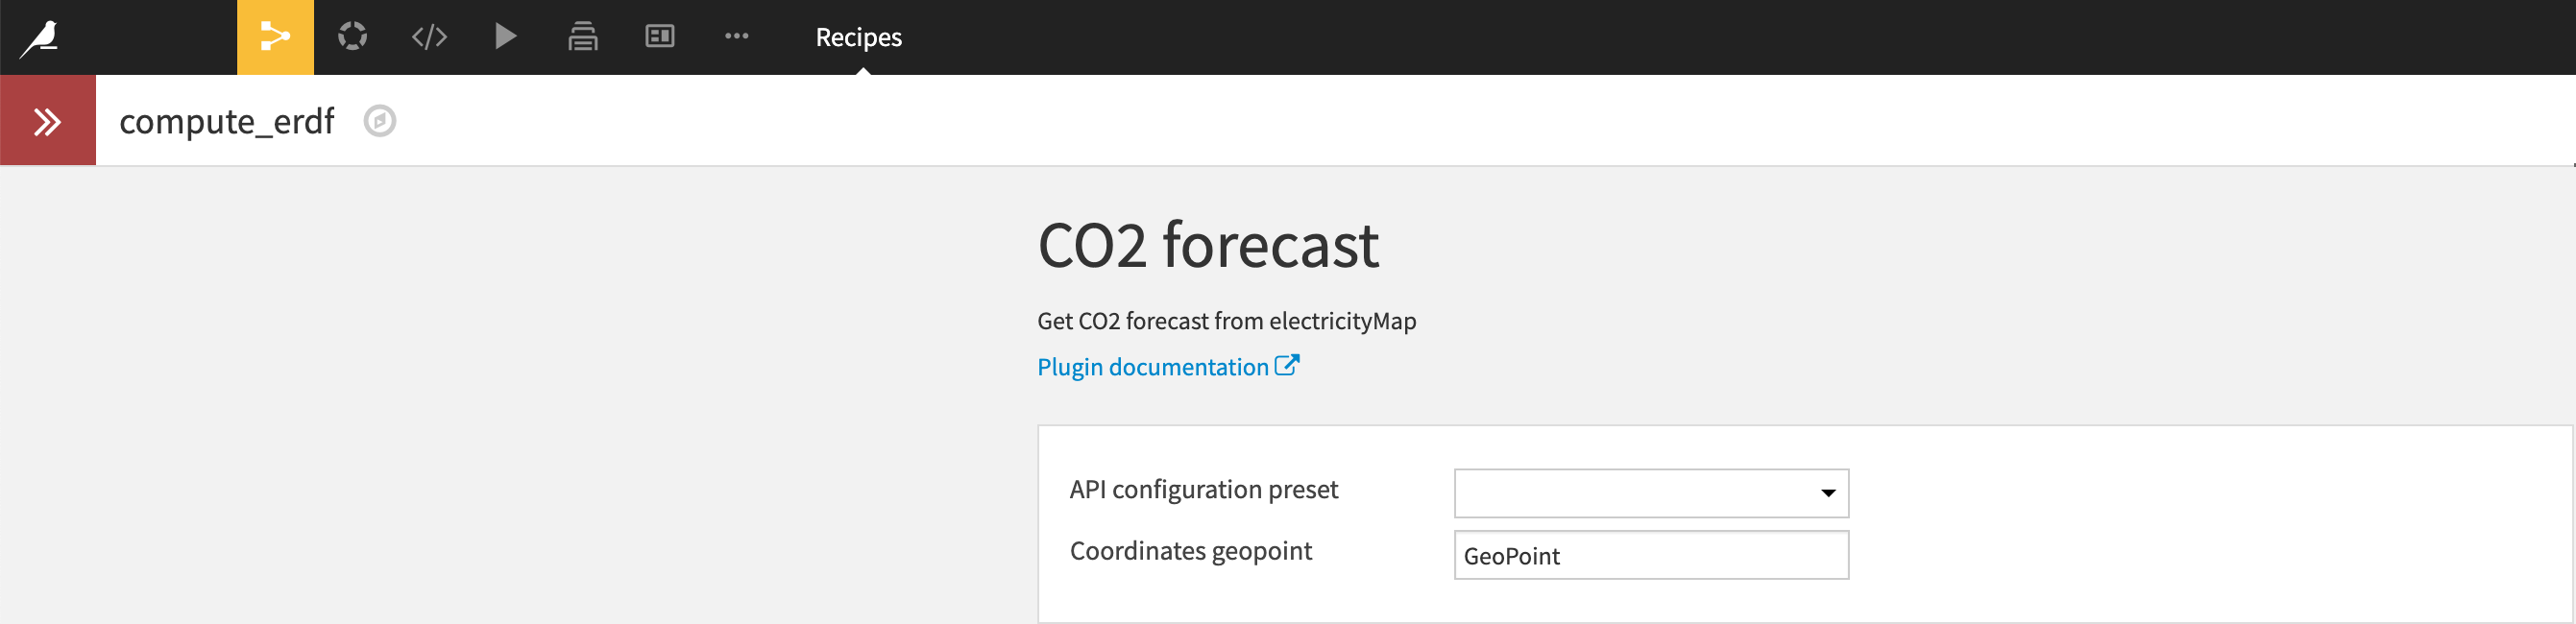
Retrieve forecasted carbon intensity:
This component adds a recipe to the flow in which you need to specify an Electricity Maps API preset and a geopoint column.
Once you run the recipe, you’ll have the carbon_intensity column containing the forecasted carbon intensity and the co2_date_time containing the date and time of the predicted values.