


Plugin information
| Version | 1.0.2 |
|---|---|
| Author | Dataiku (Marine SOBAS, Du PHAN) |
| Released | 2021-01 |
| Last updated | 2025-02-07 |
| License | Apache Software License |
| Source code | Github |
| Reporting issues | Github |
Sometimes, a standard A/B test is more relevant than a black-box model to address today’s challenges. For years, A/B testing has been a reliable method to compare two variants of the same ad, website, drug, or machine learning model. This A/B test calculator provides features to design your own A/B tests and analyses their outcomes inside DSS.
In its first version, the plugin focuses on A/B tests with rate metrics. So, it is a perfect match if you want to optimise a success rate such as a click-through rate, a conversion rate or a cure rate.
How to set up
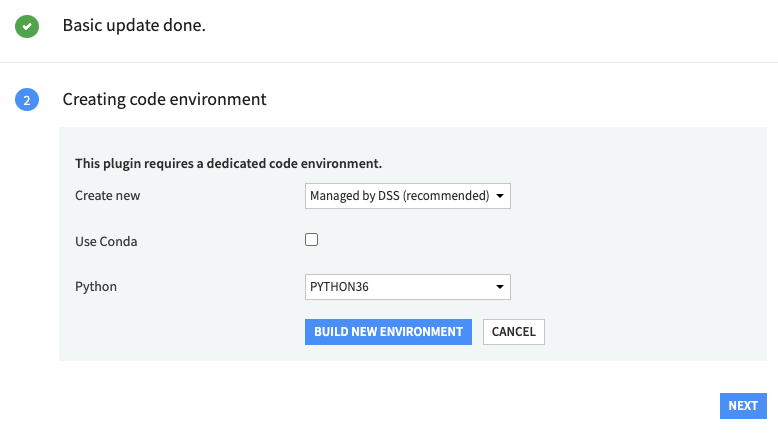
When you install this plugin, you will need to build its code environment. Note that Python version 3.6 is required.
How to use
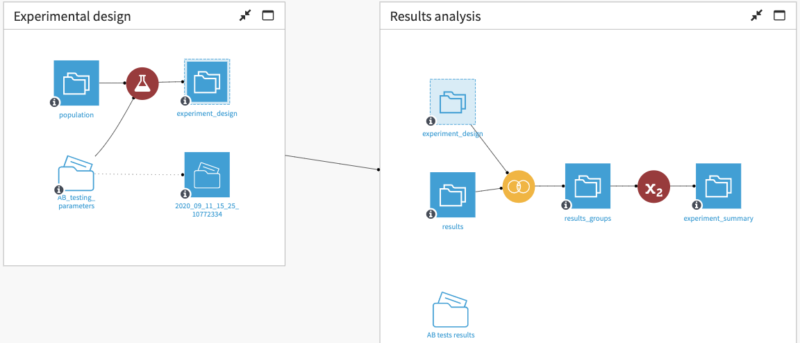
This plugin will assist you in setting up the experiment and interpreting its results. It relies on two main steps :
- Experimental design: compute the minimum sample size (1) and split your experiment population into an A and a B group (2).
- Results analysis: retrieve a statistical summary of your experiment (3) and analyse the outcome of the test (4).
Design the experiment
During this first step, you will estimate the minimum sample size required by the experiment with the A/B test sample size calculator and split your population into two groups using the Population split recipe.
1. A/B test sample size calculator
A statistically relevant A/B test requires a minimum sample size. This web app computes it and saves the experiment parameters into a managed folder.
Access the sample size calculator
- Open the </> tab and select Webapps.
- Create a new visual web app
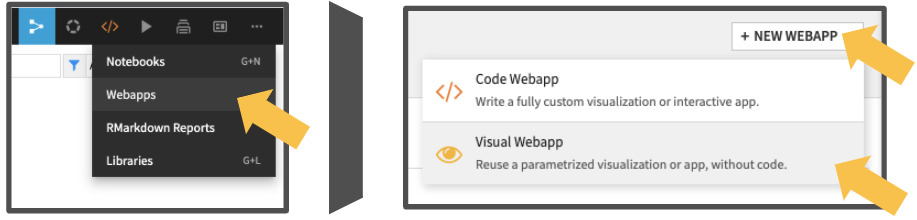
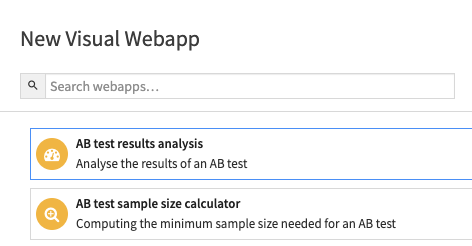
- Choose the AB test sample size calculator.
Setting up the A/B test sample size calculator web app
From the settings tab of the web app, please specify the following parameter :
Parameters folder, a managed folder where to store the parameters and sample sizes. It’s possible to create the folder from the drop-down menu.
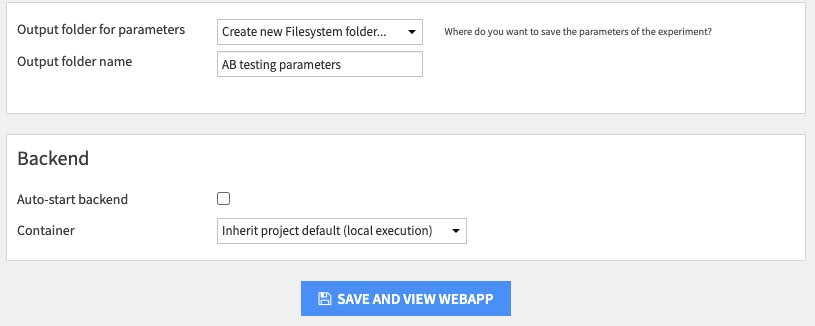
Once you set up the web app, click on “Save and view webapp”.
Computing the sample size
The minimum sample size depends on the input parameters of the web app, namely :
- Baseline success rate (%) : success rate of the baseline variant . If this value is difficult to estimate, set it to 50%, or to your average success rate.
- Minimal detectable effect (%): the minimal variation of the baseline success rate that you need to detect a significant change. This use-case dependent value has a significant impact on the sample size. You may base it upon the minimum revenue expected from the new variant B compared to A. For instance, a variant B costs $X more than A but might increase A’s baseline purchase rate by D% . To make it profitable, you need to ensure that B leads to an increase in the purchase rate of at least X divided by the baseline revenue. This is your minimum detectable effect.
- Daily number of people exposed
- Percentage of the traffic affected
From these values, a minimum sample size is computed and illustrated thanks to the chart of the distributions. Sample size computation relies on [1].
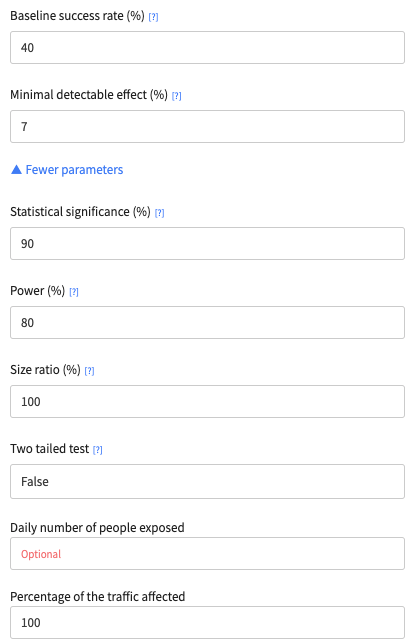
For instance, a user might want to optimise the open rate of her email campaigns. Therefore, she plans to compare two different sending times, 9 am and 2 pm, during an A/B test. The average open rate is 40%, so inside the A/B test sample size calculator, she sets a 40% baseline success rate. For her, an email campaign outperforms another if the open rate is 7% higher, so she defines a 7% minimum detectable effect. Finally, she sets a 90% statistical significance. Hence, she is confident that 90% of the time, if there is an actual difference between the two variants, the test will detect it. This leads to the following input parameters:
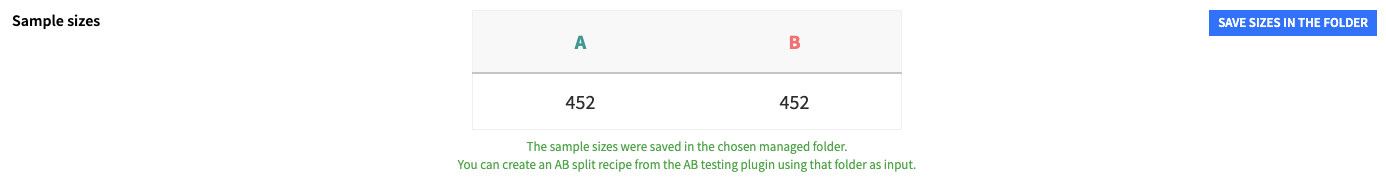
Saving the parameters
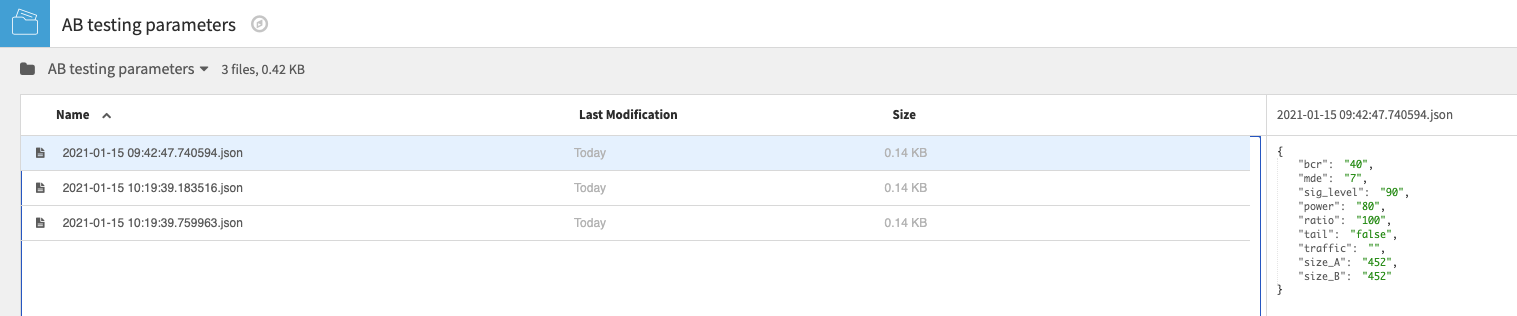
When you click on the button Save parameters, the parameters and the samples sizes are saved in the folder Parameters .
When you open this folder, you may observe your parameters stored in json files :
2. Population split
This recipe splits the users enrolled in the experiment into two groups, usually based on the sample sizes which were previously computed in the AB test sample size calculator.
Access the population split recipe
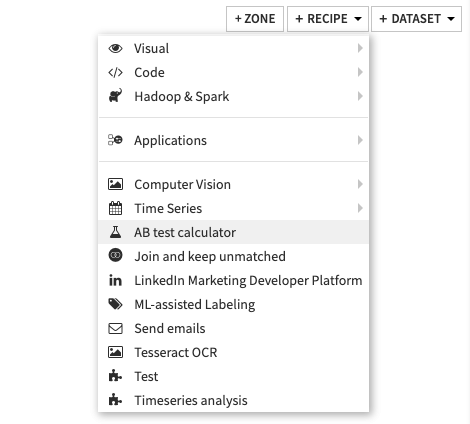
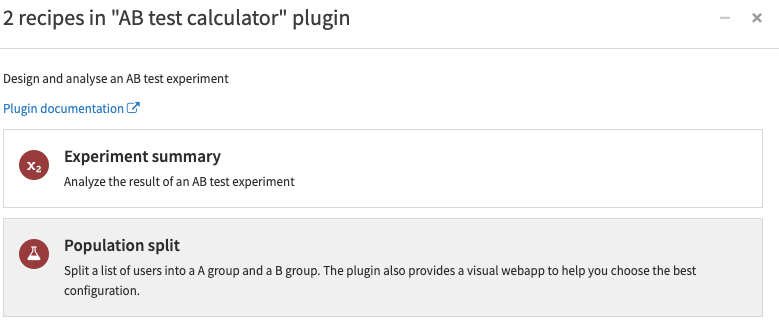
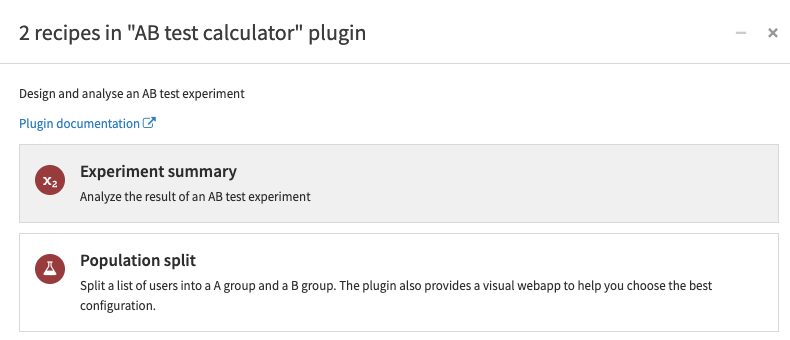
To create your first recipe, navigate to the Flow, click on the + RECIPE button and access the AB test calculator menu.
If your input dataset or/and your input folder are selected, you can directly find the plugin on the right panel.
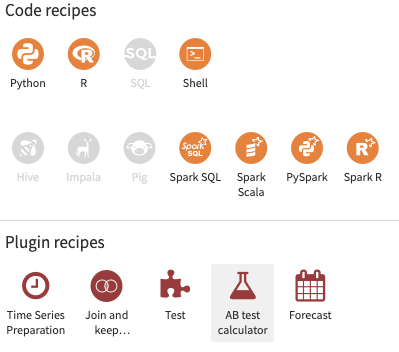
Then, select the population split recipe.
Input dataset
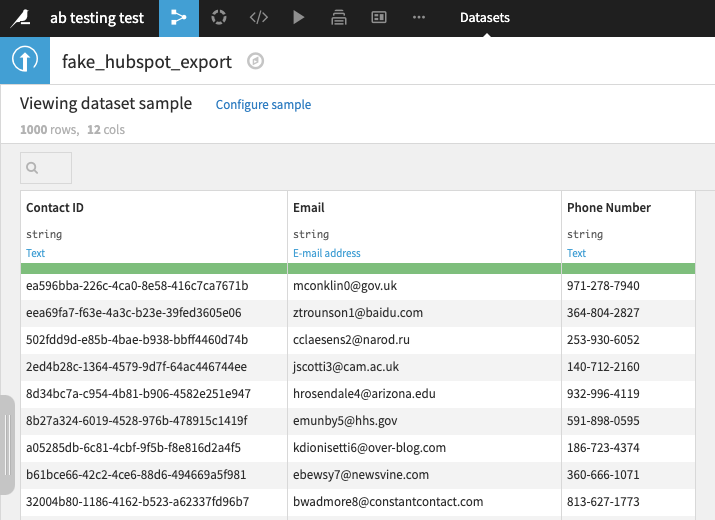
Population dataset: Dataset with the reference of the users involved in the experiment(ids, emails…) stored in one of the columns. If your experiments run on Hubspot, check out the Hubspot plugin to retrieve your contact list in a dataset format.
Parameters folder(optional): Folder containing the parameters computed in the AB test sample size calculator, mentioned previously. This is optional, you can also define the sizes manually within the settings of the recipe.
Output dataset
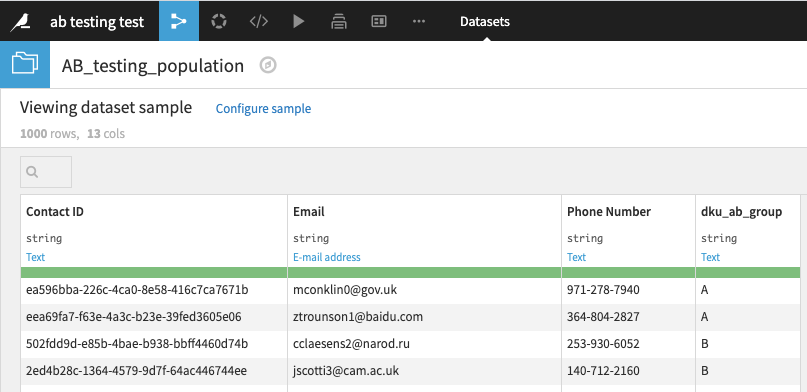
Experiment dataset: Input dataset with an extra column containing the group indicators used for the AB test (A or B)
Settings
Review the recipe parameters:
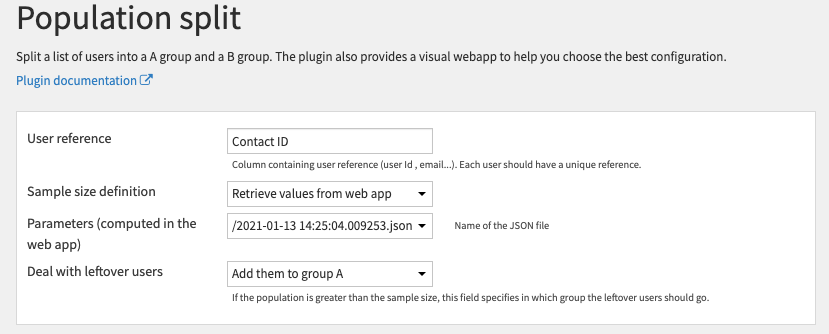
- User reference : Column containing user reference (user Id , email…). Each user should have a unique reference.
- Sample size definition : do you want to retrieve the sample sizes from the web app or edit them manually?
If you input a Parameters folder, choose the option : “Retrieve values from web app”. Otherwise, you may define the sample sizes manually.
If you want to retrieve the sample sizes from the parameters folder , choose the following parameter :
- Parameters (computed in the web app): choose which json file contains the right parameters and sample sizes. Please, make sure that your input dataset contains enough users given the sample sizes specified in the file.
If you want to edit sizes manually, specify the following parameters :
- Sample size for variation A : Minimum sample size for the A group
- Sample size for variation B : Minimum sample size for the B group
Please, make sure that your input dataset contains enough users given the sample sizes specified in the settings.
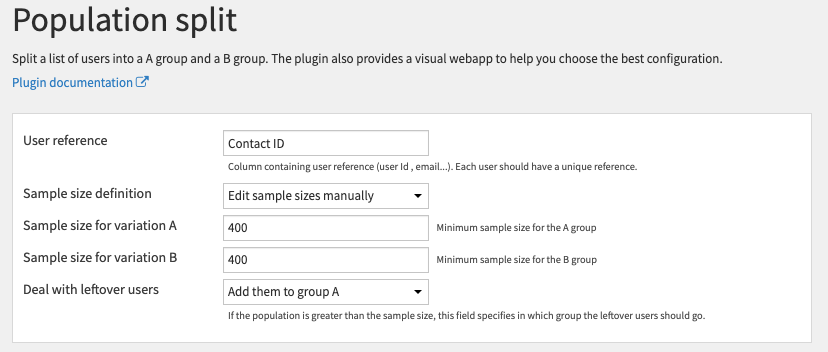
- Deal with leftover users : If the population is greater than the sample size, this field specifies in which group the leftover users should go.
Analyse the results of the experiment
Once the experiment is complete, you may upload the results back to DSS. With Experiment summary, a recipe, you compute the resulting statistics. For instance, if your success event is a click, it will be the click through rates for each group. With the results analysis web app, you can analyse these results and determine the outcome of the statistical test.
3. Experiment summary
Access the experiment summary recipe
To create your first recipe, navigate to the Flow, click on the + RECIPE button and access the AB test calculator menu.
If your input dataset is selected, you can directly find the plugin on the right panel.
Then, select the experiment summary recipe.
Input dataset
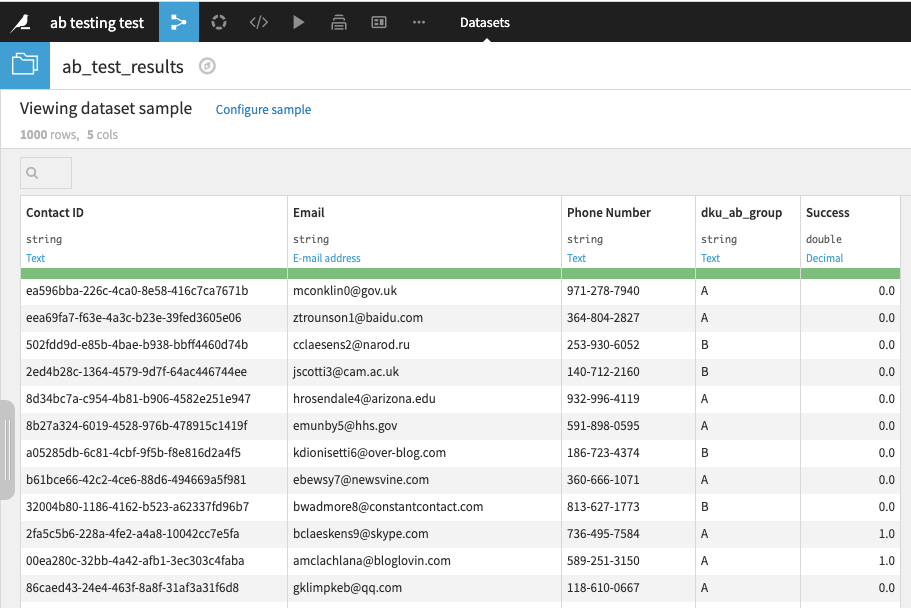
experiment_results: This dataset should contain the experiment’s results at a user level. There should be a group and a success column. The group column should contain only two values such A & B or group_A, & group B. The success column should be only zeros and ones. 1, represents a successful event and 0 a failure.
Output dataset
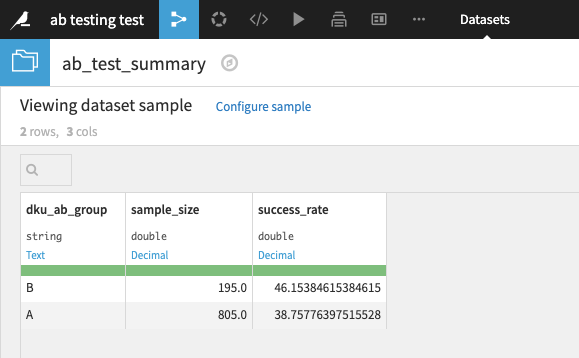
AB testing statistics: Statistics required to answer the statistical test. For each group, you get the sample size and the success rate.
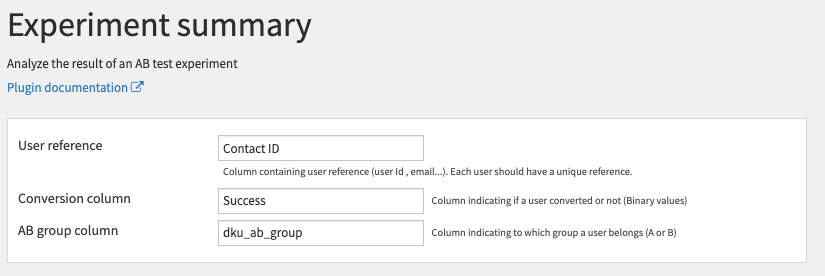
Settings
- User reference : Column containing user reference (user Id , email…). Each user should have a unique reference. If you previously used the Population split recipe, it should be the same value.
- Conversion column : Column indicating if a user converted or not (Binary values)
- AB group column : Column indicating to which group a user belongs. This column should contain binary values (O-1, A-B, group_A-group_B)
4. Results analysis
This web app analyses the outcome of the A/B test and
Accessing the results analysis web app
- Open the </> tab and select Webapps.
- Create a new visual web app
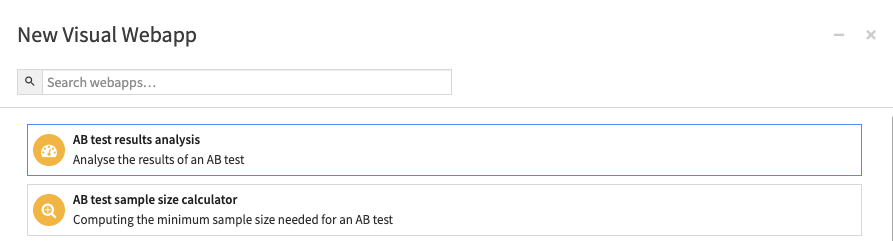
- Choose the AB test results analysis.
Setting the result analysis web app
- AB statistics entry from : do you want to retrieve statistics from the
AB testing statisticsdataset or just enter the values manually?
Select “an input dataset”, if you already performed the Experiment summary recipe and want to analyse the computed statistics. Otherwise, use the manual mode.
- Dataset : It should be the output of the recipe AB statistics of the AB testing plugin.
- AB group column : Column indicating to which group a user belongs (A or B)
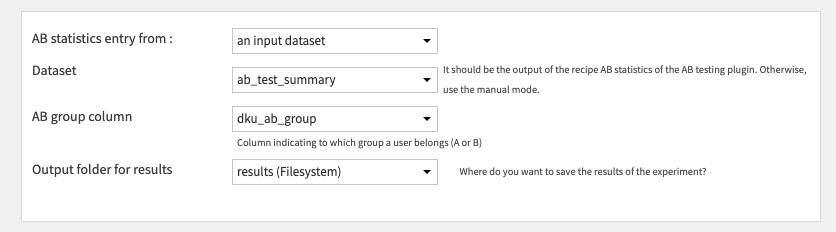
- Output folder for results : Where do you want to save the results of the experiment?
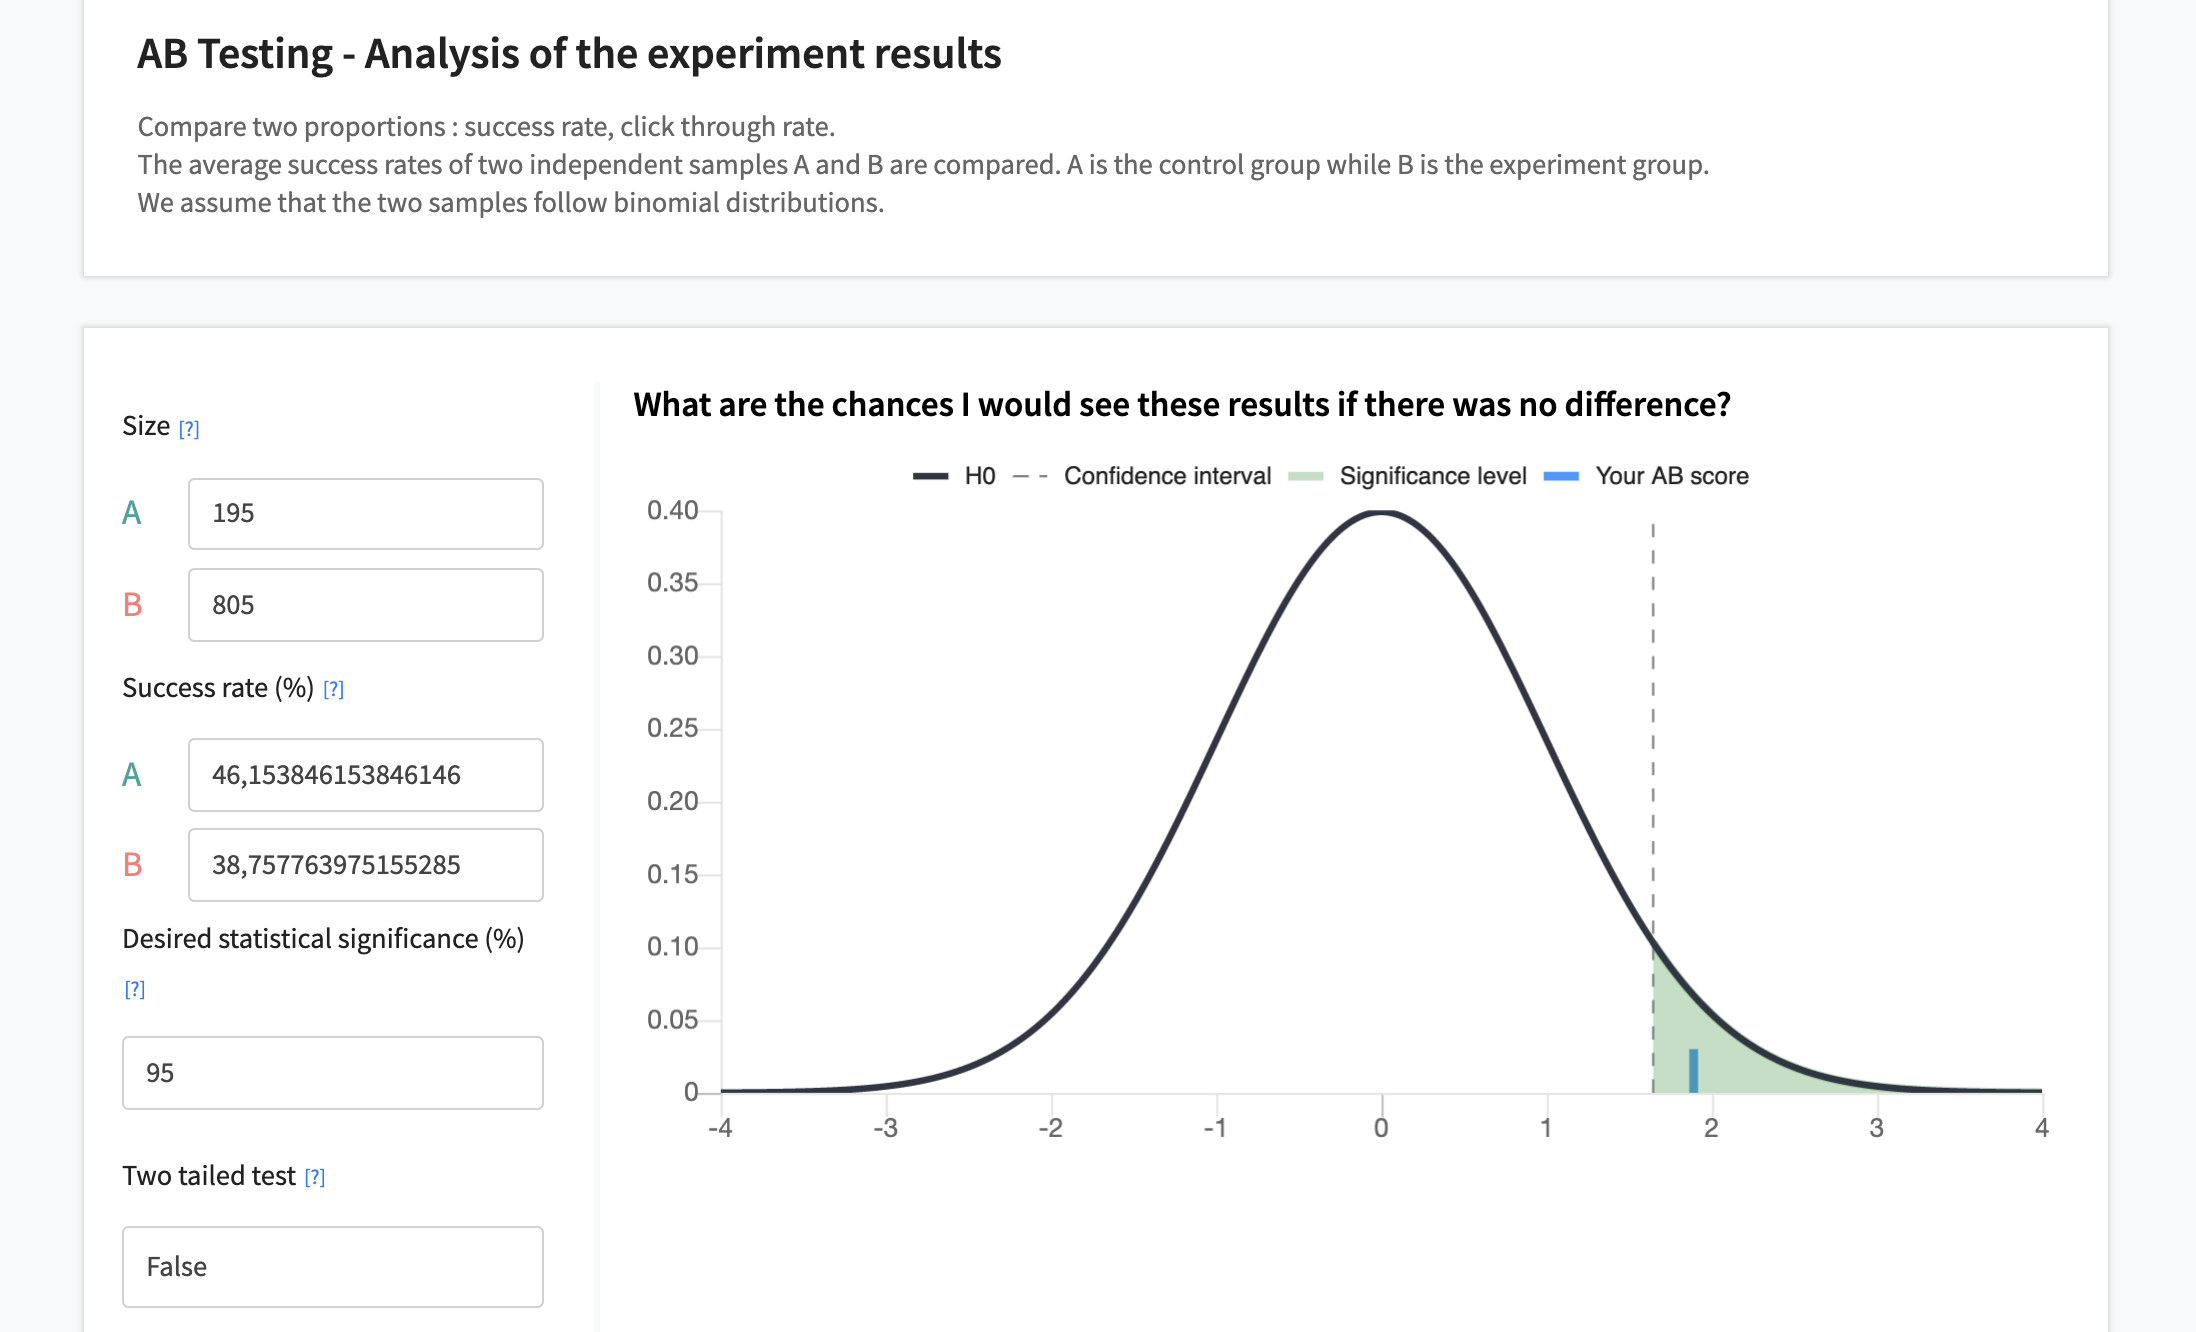
Computing the results of the experiment
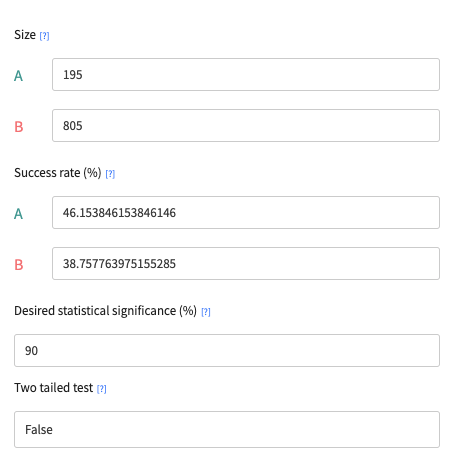
The results of the experiments are computed based on the following input parameters:
- The sample size for each group
- Their success rates
- Desired statistical significance: probability to find that the two samples have the same success rate, when this is the case. It is therefore the minimum threshold of the true positive probability. Its most common values are 95% and 90%.
- Two tailed test: Are you willing to test for an increase in success rate, a decrease, or even both? If you only want to determine if there is any difference between the two groups, you should use a two-tailed test. It means that you are testing both for positive and negative differences. However, if you only test in one direction, to find out for instance, whether the success rate is higher for B, you may want to use a one-tailed distribution. For example, if you test a new email template, your major concern is whether it leads to more conversion. A two-tailed test is not necessary since you are only interested in positive changes.

The parameters of the results analysis web app – Note that these sizes and success rates were retrieved from the AB_testing_statisticsdataset.
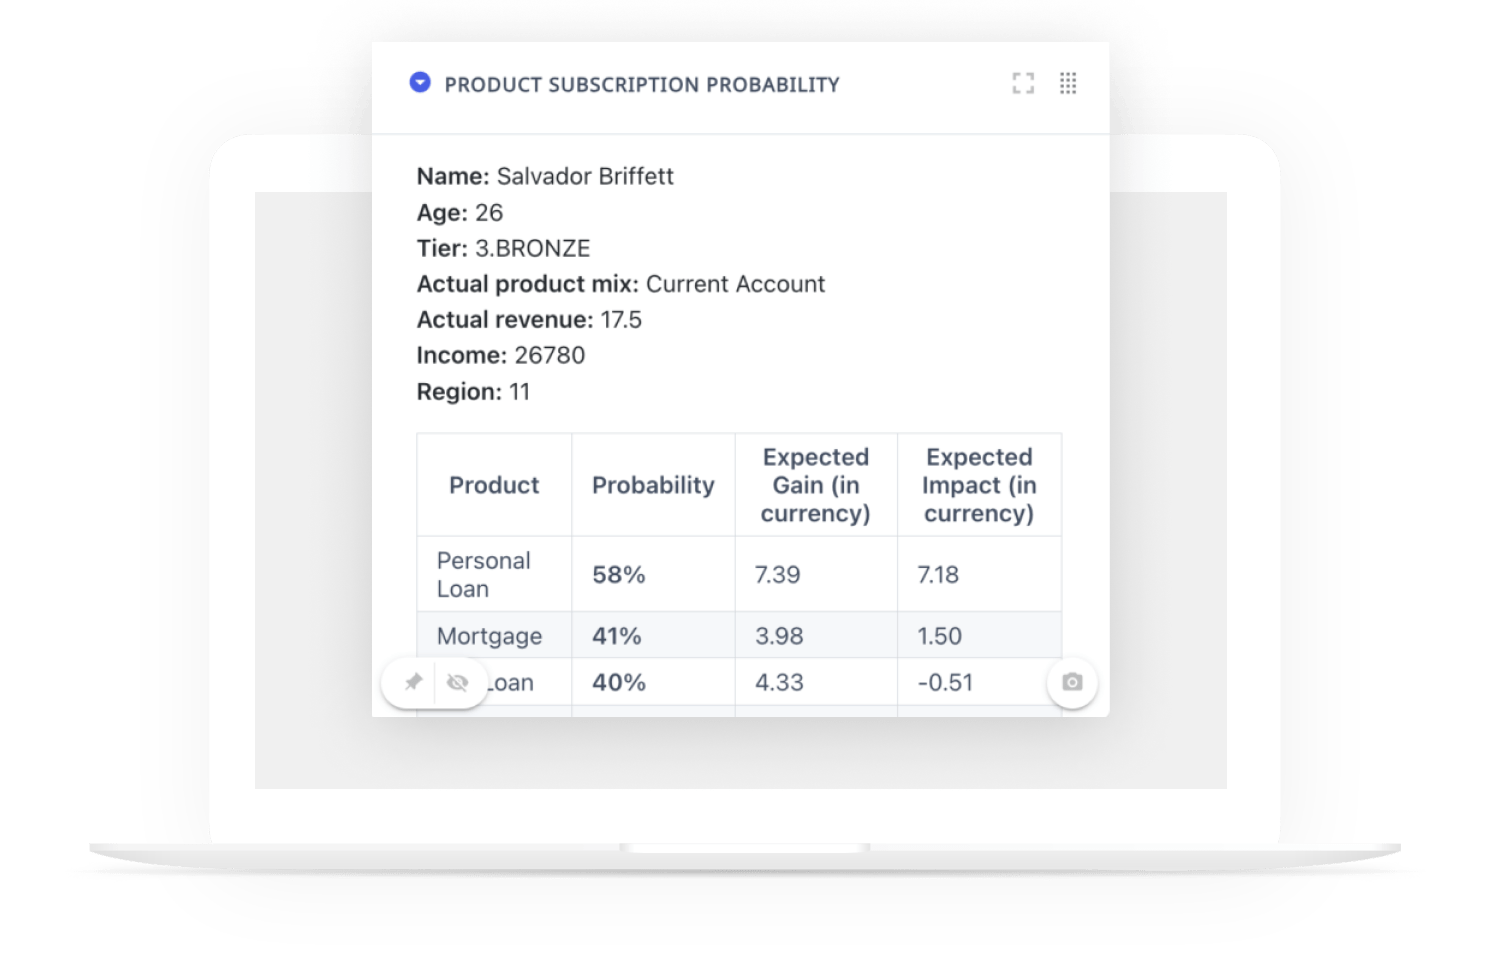
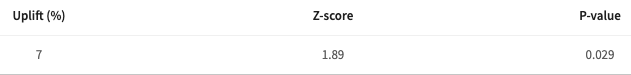
The results are displayed in the results box below. On the left hand side, a sentence explains the results of the A/B tests.

One the right hand side, a table displays some indicators about the test, namely ..
- the uplift, the difference in success rate between the two variants (%)
- the Z score: how many standard deviations below or above the population mean a raw score is. [2]
- the p value: the probability to obtain the following results were there no actual difference between the success rates.
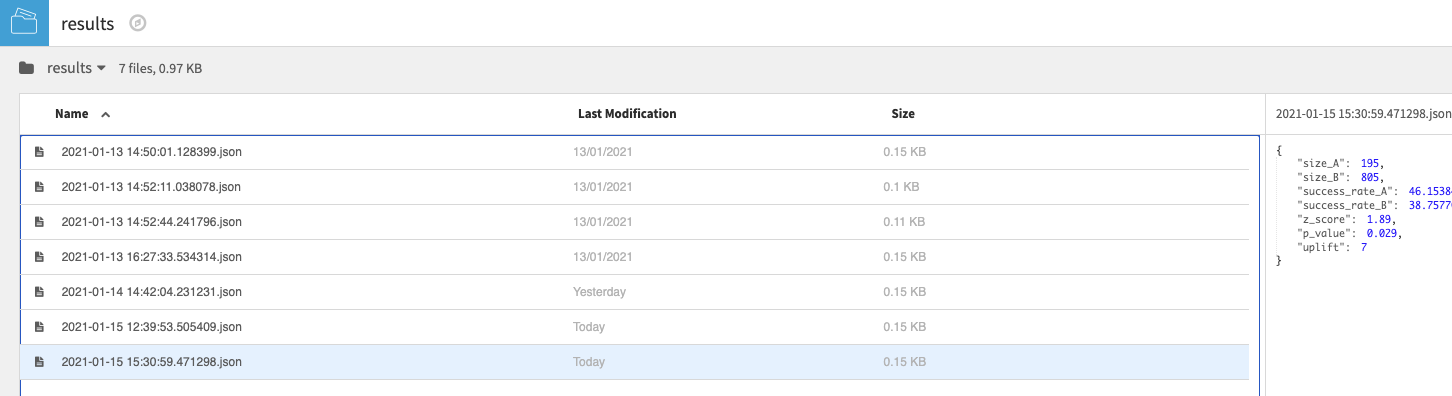
Saving the results in the output folder
When you click on the button save parameters, the parameters and the samples sizes are saved in the folder Results .
When you open this folder, you may observe your results stored in json files :
References
[1] S. Holmes. POWER and SAMPLE SIZE Introduction to Statistics for Biology and Biostatistics (2004)
[2] Stephanie Glen. “Welcome to Statistics How To!” From StatisticsHowTo.com: Elementary Statistics for the rest of us! https://www.statisticshowto.com/