RAG observability: how to monitor semantic relevance and retrieval quality
September 17, 2026/7 min read/Team Dataiku
Retrieval-augmented generation (RAG) improves answer quality by grounding model outputs in external knowledge. But retrieval performance is often a blind spot in production. Teams track response times and token usage yet miss whether the right documents are being retrieved and used effectively.
A RAG system can return a response in under two seconds, stay within its token budget, and show zero errors, while grounding its answer in a document that was relevant to a different question, outdated by six months, or retrieved because of a spurious embedding similarity rather than a genuine semantic match.
RAG observability closes that gap. It provides visibility into retrieval quality, semantic relevance, faithfulness, latency, and cost so that teams can identify degradation before users notice it and fix root causes rather than symptoms.
This guide explains how to measure, instrument, evaluate, and monitor retrieval performance so RAG systems remain accurate, reliable, and cost-efficient at scale.
RAG observability monitors the retrieval layer specifically: whether the right documents are retrieved, whether they are semantically relevant to the query, and whether the generated answer is faithful to the retrieved content.
Six core metrics define retrieval quality: retrieval precision, recall, semantic relevance score, faithfulness, latency, and cost per query.
Instrumentation requires tracing across the full RAG pipeline (query, retrieval, generation, response), not just endpoint-level logging.
Offline evaluation establishes baselines. Production monitoring detects degradation. The combination is what makes RAG systems reliable at scale.
Without RAG observability, hallucinations from irrelevant retrievals, hidden latency bottlenecks, and spiraling token costs remain invisible until users report them.

RAG observability is the practice of monitoring the retrieval, ranking, and generation stages of a retrieval-augmented generation pipeline to ensure that the documents feeding the model are relevant, current, and correctly used in the generated response.
Without this visibility, three failure modes remain undetected until they cause business impact.
The most common RAG failure is not a generation error. It is a retrieval error: the system retrieves documents that are topically adjacent but not actually relevant to the query, and the generation model synthesizes them into a confident, incorrectanswer. The user sees an authoritative response. The response is grounded in the wrong documents.
RAG pipelines involve multiple steps (embedding generation, vector search, re-ranking, context assembly, generation). A latency spike in any step affects end-to-end response time, but endpoint-level monitoring only shows the total. Without step-level tracing, the team cannot identify which component caused the degradation.
Retrieving too many chunks, passing redundant context, or failing to cache common queries all inflate token consumption. At production volumes (thousands of queries per day), a retrieval configuration that wastes 30% of its context window on irrelevant chunks adds up to significant unnecessary spend.
Enterprise production incidents illustrate the stakes. Organizations deploying RAG at scale have reported significant accuracy drops when retrieval quality degraded silently over weeks, with root causes typically traced to stale vector indexes, changed document structures, or embedding model drift. Cost overruns well above projected budgets have been traced to retrieval configurations that returned excessive chunk counts without relevance filtering.
These failures are detectable and preventable with the right metrics, instrumentation, and monitoring. The sections that follow provide that framework.
Six metrics define what RAG observability measures. Each metric maps to a specific user pain point and has a target baseline that teams should calibrate against their own data.
Semantic relevance measures how well the retrieved documents match the intent and meaning of the query, not just surface-level keyword overlap.
Two measurement approaches serve different cost-performance trade-offs.
LLM-as-judge evaluation uses a second model (via frameworks like Ragas or Langfuse) to score each retrieved document's relevance to the query on a defined scale. This provides the highest-fidelity relevance assessment but adds inference cost per evaluation.
Cosine similarity between query embeddings and document embeddings provides a lightweight production check with near-zero additional cost, though it captures less nuance than LLM-based evaluation.
Recommended sampling strategy: run LLM-as-judge evaluation on 10% of production queries to maintain quality oversight while controlling evaluation costs. Run cosine similarity checks on 100% of queries as the continuous monitoring layer.
Target baseline: calibrate against your offline evaluation results rather than a universal threshold, since acceptable relevance scores vary significantly by domain and use case. As a starting point, scores consistently below 0.70 on a 0-1 cosine similarity scale warrant investigation, but the meaningful threshold is whatever your offline evaluation established as the minimum acceptable quality for your specific retrieval configuration.
Retrieval precision measures the ratio of relevant retrieved chunks to total chunks returned. A retrieval that returns 10 chunks but only 4 are relevant to the query has a precision of 0.40, meaning 60% of the context window is wasted on irrelevant content.
Formula: relevant retrieved chunks / total retrieved chunks.
Precision directly affects both answer quality (irrelevant chunks dilute the signal) and cost (every chunk consumes context window tokens). Chunk size and overlap parameters are the primary configuration variables that affect precision. Smaller chunks with higher overlap typically improve precision but increase the total number of chunks to search.
Target baseline: 0.60 or higher. Below 0.50 indicates that the retrieval configuration is returning more noise than signal.
Faithfulness measures whether the generated answer is actually supported by the retrieved documents, not just whether relevant documents were retrieved. A system can retrieve the right documents and still generate an unfaithful answer if the generation model introduces unsupported inferences.
The Ragas faithfulness metric decomposes the generated answer into individual claims and checks each against the retrieved context. The score is the ratio of supported claims to total claims.
Threshold-based alerting: faithfulness scores below 0.85 should trigger investigation. Scores below 0.70 should trigger immediate review and potential pipeline suspension for high-stakes use cases. Connecting faithfulness monitoring to semantic relevance scores provides a more complete picture: low faithfulness with high relevance suggests a generation problem, while low faithfulness with low relevance suggests a retrieval problem.
RAG latency must be traced at the step level, not just the endpoint level. Capture trace timers for each stage: embedding generation, vector search, re-ranking (if applicable), context assembly, and generation.
Token usage per model call and cost per 1,000 queries are the financial metrics. Track both alongside quality metrics to prevent cost optimization from degrading retrieval quality (reducing chunk count to save tokens may drop precision below acceptable thresholds).
Target baselines: P95 end-to-end latency under three seconds for user-facing applications. Cost per 1,000 queries within the budget established during pilot evaluation.
Instrumentation captures the telemetry that metrics depend on. Without step-level tracing across the full RAG pipeline, monitoring operates on endpoint-level aggregates that hide the root cause of quality and performance issues.
Every retrieval operation should generate a trace span with consistent attributes: query text (or hash for sensitive content), number of documents requested (k), vector store identifier, retrieval timestamp, and the document IDs or snippet hashes of returned results.
from opentelemetry import trace
tracer = trace.get_tracer("rag.pipeline")
with tracer.start_as_current_span("rag_retrieval") as span:
    span.set_attribute("rag.query_hash", hash(query_text))
    span.set_attribute("rag.k", 5)
    span.set_attribute("rag.vector_store", "pinecone_prod_v2")
    span.set_attribute("rag.retrieved_doc_count", len(results))
    span.set_attribute("rag.topsimilarityscore", results[0].score)
Use correlation IDs to link spans across retrieval, generation, and response phases. This enables dashboard drill-down from a high-level quality alert to the specific retrieval that caused the issue.
Store the full prompt template hash (not raw text when dealing with sensitive content) alongside the generated response. This enables retrospective analysis of which prompt configurations correlate with quality changes.
For non-sensitive environments, logging the full assembled prompt (system instruction + retrieved context + user query) enables the most detailed debugging. For sensitive environments, log the template hash, retrieved document IDs, and response, with raw content available only through a secured audit access path.
Use LLM framework callbacks (LangChain callbacks, LlamaIndex event handlers) to capture token counts within the same trace span as the retrieval and generation steps. Emit cost metrics calculated from token usage and model pricing for real-time budget tracking.
# Example: token tracking via callback
def on_llm_end(response):
    span = trace.get_current_span()
    span.set_attribute("llm.input_tokens", response.usage.input_tokens)
    span.set_attribute("llm.output_tokens", response.usage.output_tokens)
span.set_attribute("llm.cost_usd", calculate_cost(response.usage))Offline evaluation establishes the baselines that production monitoring compares against. Without baselines, alerts have no thresholds and degradation has no reference point.
Build or generate a representative QA dataset using tools like the Ragas TestsetGenerator, which creates diverse question types (factual, reasoning, multi-hop) from the document corpus. Aim for 200 to 500 question-answer pairs that represent the query distribution the system handles in production.
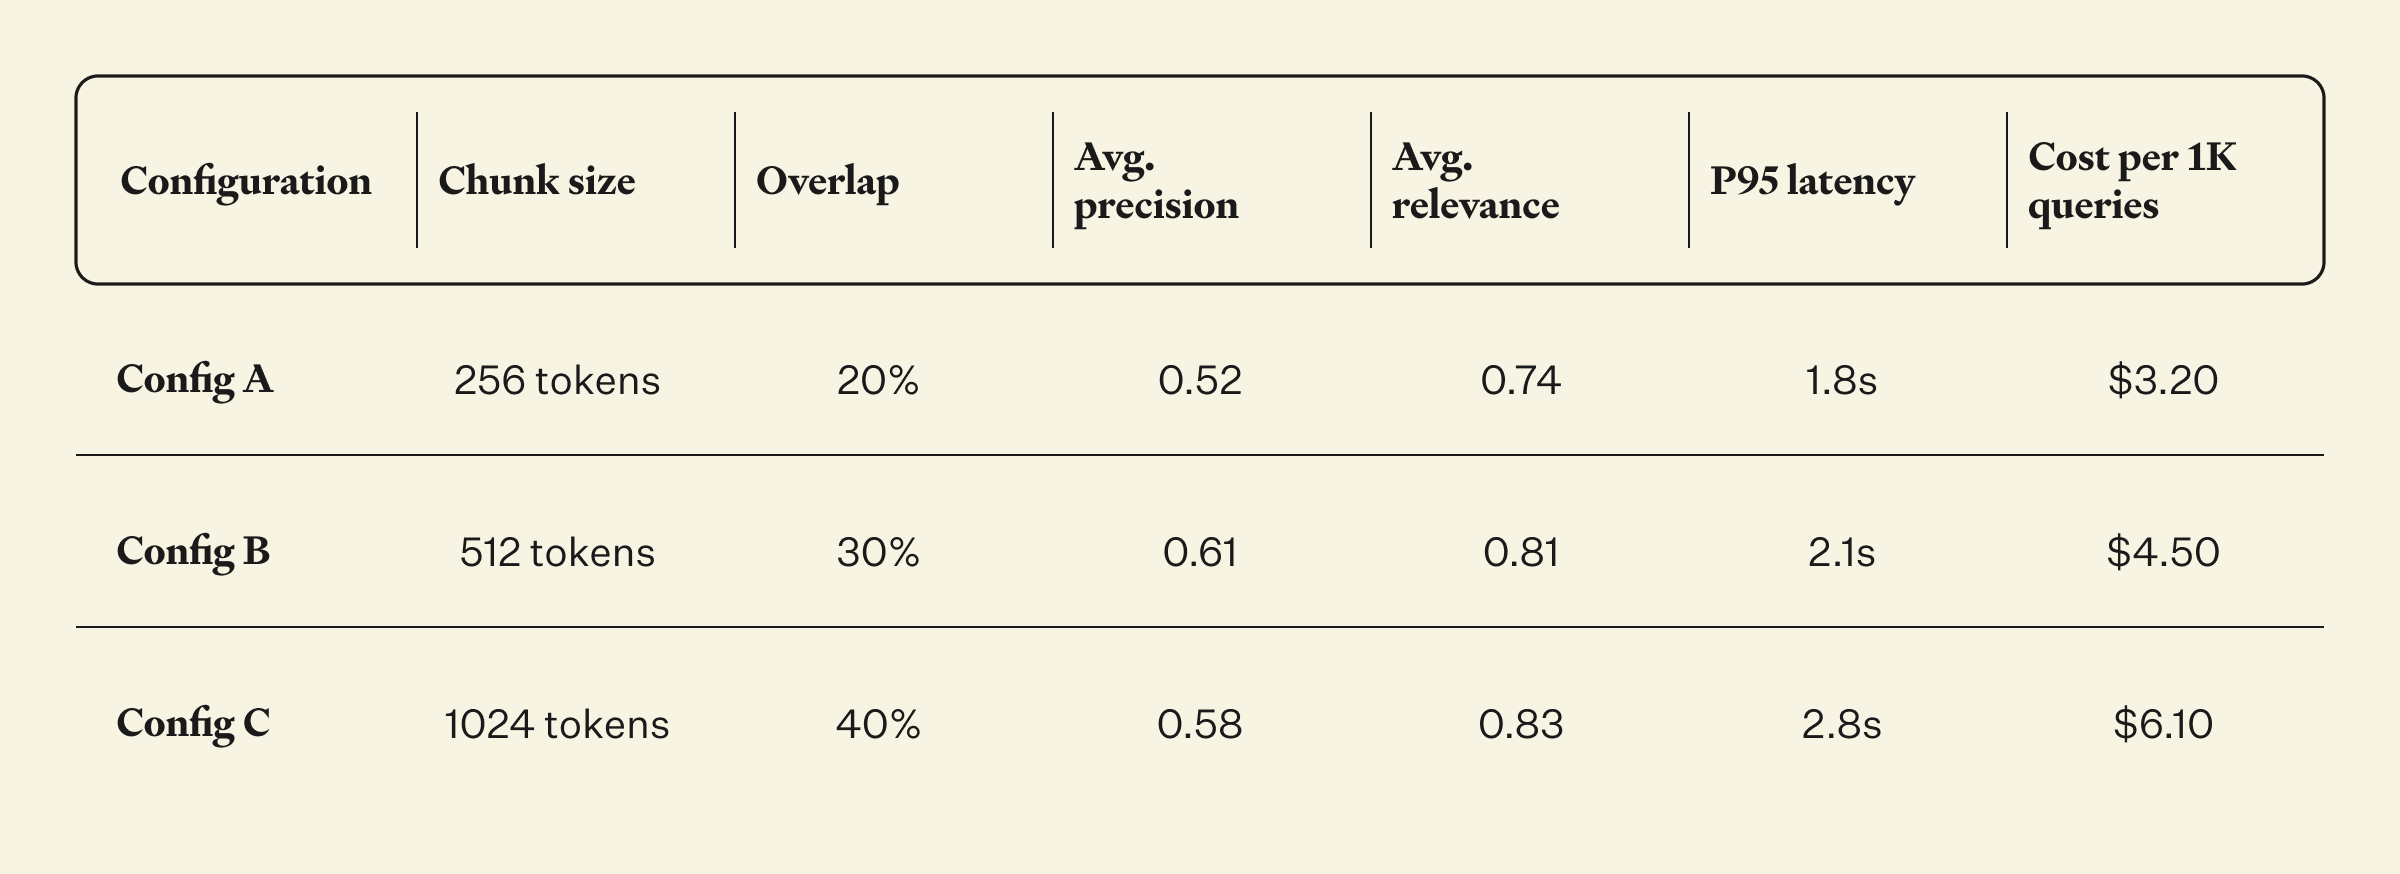
Run experiments varying chunk size and overlap parameters. A typical experiment matrix:
*Click on the image to see the full PDF
Apply LLM-judge scoring to each configuration across the test set. The configuration with the best balance of precision, relevance, latency, and cost becomes the production baseline. Record these baselines: they are the thresholds that production monitoring alerts against.
Production monitoring bridges the gap between offline evaluation (known queries, controlled conditions) and real-world usage (unknown queries, evolving documents, shifting user behavior).
Stream production traces to an evaluation pipeline at regular intervals (every five to ten minutes for high-volume systems, hourly for lower-volume ones). Calculate rolling-window semantic relevance scores and compare against the baselines established during offline evaluation.
Configure automated alerts when relevance scores drop below threshold. Two alert tiers: a warning when scores drop 10% below baseline (triggers investigation) and a critical alert when scores drop 20% below baseline (triggers immediate review and potential pipeline modification).
Embedding distribution drift detection catches a specific failure mode that point-in-time metrics miss: gradual degradation in retrieval quality as the underlying document corpus evolves while the vector index remains static. Monitor the distribution of similarity scores over time. A gradual leftward shift (scores trending lower) indicates that the embeddings no longer represent the current document set accurately and the index needs refreshing.
A production RAG observability dashboard displays four metric groups on a single pane: retrieval quality (precision, semantic relevance), answer quality (faithfulness), performance (P50, P95, P99 latency by pipeline stage), and cost (token usage, cost per query, cost trend).
Dashboard design principles: use percentile widgets (P50, P95, P99) for latency rather than averages, which hide tail latency problems. Use heatmaps for time-of-day patterns that reveal when retrieval quality degrades (often correlated with peak load or batch index refresh timing). Enable trace drill-down links from every dashboard anomaly to the individual request trace, so the team can move from "retrieval quality dropped at 2pm" to "this specific query retrieved these specific irrelevant documents" in two clicks.
Example aggregation pattern for retrieval precision over time:
SELECT
  date_trunc('hour', timestamp) AS hour,
  AVG(relevant_chunks::float / total_chunks) AS avg_precision,
  COUNT(*) AS query_count
FROM rag_traces
WHERE timestamp > now() - interval '7 days'
GROUP BY 1
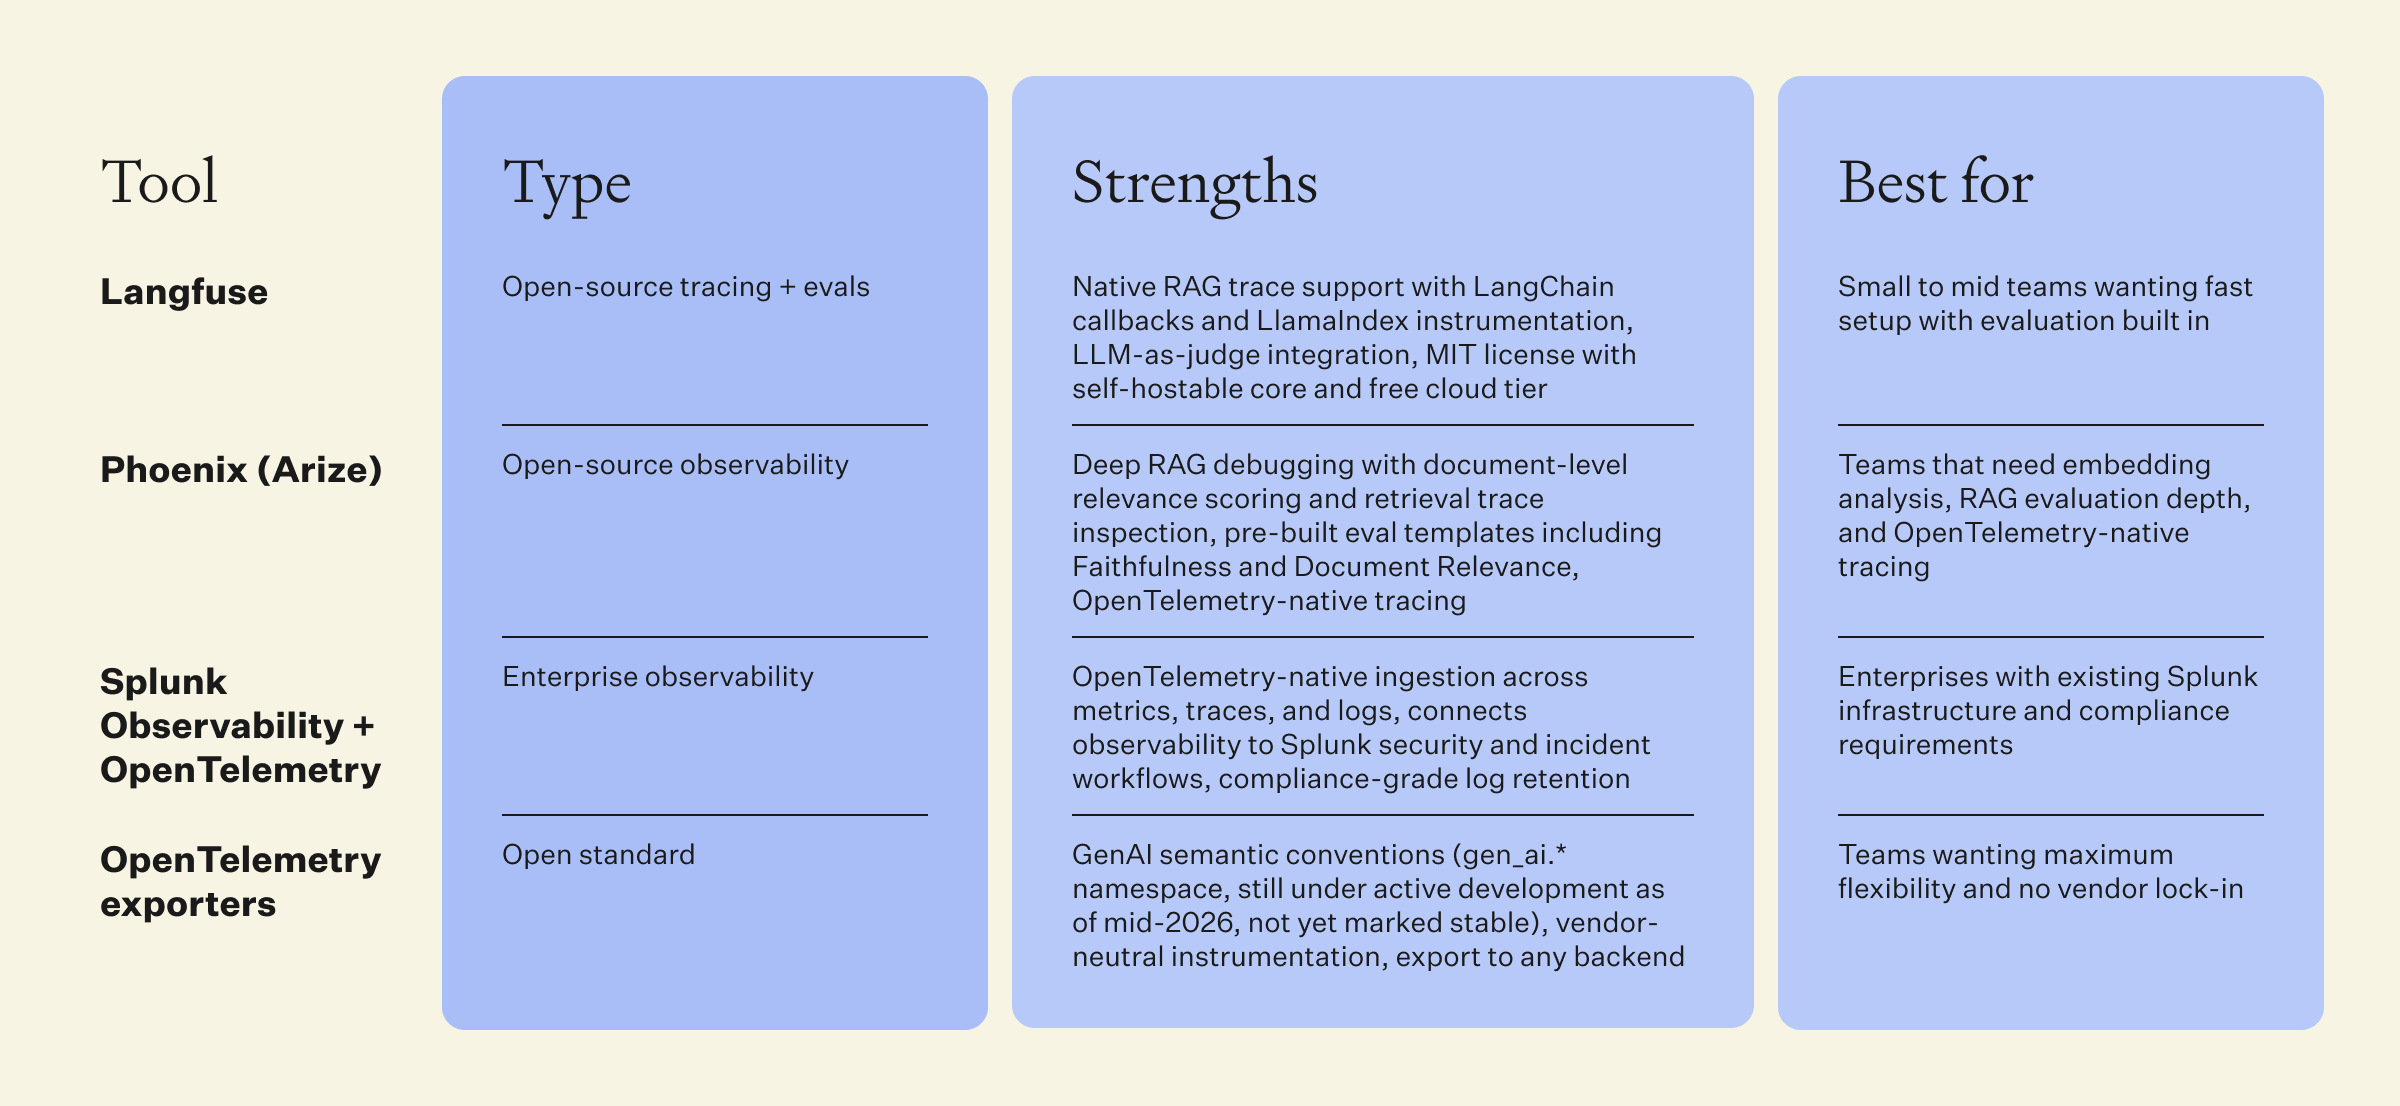
ORDER BY 1;Four solution categories serve different team sizes and requirements.
*Click on the image to see the full PDF
Information verified as of Aug 2026
The Dataiku LLM Mesh combines RAG building blocks with monitoring, cost controls, and governance in a single environment. For enterprises that need retrieval quality monitoring alongside model routing, cost management, and audit-ready governance, it eliminates the integration overhead of assembling separate tracing, evaluation, and governance tools.
Five steps from zero instrumentation to production-grade RAG observability.
Instrument every stage of the RAG pipeline with trace spans: query processing, embedding generation, vector search, re-ranking, context assembly, and generation. Use OpenTelemetry or framework-native decorators (Langfuse @observe, LangChain callbacks).
Common pitfall: Missing correlation IDs between spans prevents end-to-end trace reconstruction and makes root-cause analysis impossible.
Generate a representative QA dataset. Run chunk-size experiments. Score each configuration with LLM-judge evaluation. Record precision, relevance, faithfulness, latency, and cost baselines. These baselines become alert thresholds.
Configure two-tier alerting: warning at 10% below baseline, critical at 20% below baseline. Apply to semantic relevance, precision, and faithfulness independently.
Common pitfall: Setting thresholds too tight generates alert fatigue; too loose misses real degradation.
Stream production traces to an evaluation pipeline. Run LLM-judge scoring on a 10% sample. Run lightweight similarity checks on 100%. Calculate rolling-window scores and compare against baselines.
Common pitfall: Running LLM-judge on 100% of queries inflates evaluation costs beyond the retrieval costs they are monitoring.
Review dashboard trends, alert volumes, and false-positive rates weekly for the first 90 days. Adjust thresholds based on production experience. Shift to biweekly or monthly once baselines are stable.
Common pitfall: Skipping reviews after initial setup leads to threshold decay as the system evolves.
RAG observability is the infrastructure that makes confident scaling possible. Without it, retrieval quality degrades silently, costs escalate without explanation, and hallucinations reach users before anyone detects them. With it, teams catch degradation early, trace problems to their root cause, and maintain the retrieval quality that makes RAG worth deploying.
Start instrumentation this week using the tooling that fits your team size and infrastructure. Monitor for one week. Tune alert thresholds based on false-positive rates. Repeat the evaluation cycle quarterly as the document corpus, query distribution, and model versions evolve.
Dataiku, the Platform for AI Success, helps teams build and monitor governed RAG applications at scale, connecting retrieval quality monitoring to the cost controls, governance workflows, and audit trails that enterprise RAG deployments require.
Semantic relevance determines whether the documents feeding the generation model actually address the user's query. Low relevance means the model generates answers grounded in the wrong information, which produces hallucinations that are indistinguishable from correct answers at the output level. Monitoring semantic relevance catches this failure mode before it reaches users, which endpoint-level metrics (latency, error rate) cannot do.
Lightweight checks (cosine similarity, precision calculations) should run on every query. LLM-as-judge evaluation (semantic relevance, faithfulness scoring) should run on a 10% sample to balance quality oversight with evaluation cost. Dashboard reviews should follow a weekly cadence for the first 90 days, shifting to biweekly or monthly once baselines are stable. Re-evaluate baselines fully (offline evaluation with updated QA dataset) quarterly or after any significant change to the document corpus, embedding model, or retrieval configuration.
Observability data feeds three improvement loops. Trend analysis reveals gradual degradation (embedding drift, document staleness) before it reaches alert thresholds. Root-cause tracing connects quality drops to specific pipeline components (retrieval, re-ranking, generation), directing fix effort to the actual problem rather than symptoms. Configuration optimization uses precision and relevance data from production queries to refine chunk size, overlap, k-value, and re-ranking parameters beyond what offline evaluation alone can achieve.
Three dynamics degrade retrieval quality in production. Document corpus growth adds new content that existing embeddings do not represent, reducing recall for queries about recent topics. Query distribution shift means users ask questions that differ from the evaluation dataset, exposing gaps in retrieval coverage. Embedding staleness occurs when the vector index is not refreshed frequently enough to reflect document changes. All three are gradual, which is why continuous monitoring with drift detection is essential.
Generate a representative QA dataset (200 to 500 question-answer pairs reflecting production query distribution). Run the RAG pipeline against this dataset under controlled conditions. Score outputs using LLM-judge evaluation for semantic relevance and faithfulness, and calculate precision, latency, and cost per query. Record these scores as baselines. Production monitoring then compares real-time metrics against these baselines, with alerts configured at defined deviation thresholds (10% for warning, 20% for critical).
Tags