What is AI semantic observability? Concepts, architecture, and rollout guide
September 29, 2026/7 min read/Team Dataiku
As enterprises scale AI initiatives, understanding model outputs is becoming as important as monitoring system performance. Traditional observability tools reveal what happened within an AI workflow: which model was called, how long it took, whether it returned an error. The meaning, intent, and reasoning behind the output require a different monitoring discipline entirely.
A customer support agent that resolves a billing dispute in 1.2 seconds with zero errors but cites a policy that was retired last quarter is a system that traditional observability calls healthy. Semantic observability calls it a governance failure, because it tracks not just whether the system responded but whether the response meant what it should mean.
Gartner® states, "Forty percent of organizations deploying AI will implement dedicated AI observability tools by 2028 to monitor model performance, bias and outputs, according to Gartner, Inc.*
This guide defines semantic observability, explains its architecture, maps the standards that support it, provides a four-step implementation roadmap, and illustrates the discipline through three enterprise use cases.
Semantic observability is the practice of capturing and analyzing meaning-level signals from AI systems: reasoning quality, intent alignment, policy adherence, and factual grounding.
It adds a "meaning layer" on top of traditional observability (metrics, logs, traces), making AI outputs explainable, auditable, and governable.
A four-layer architecture (data, model, behavior, semantic) organizes the telemetry that semantic observability captures.
OpenTelemetry semantic conventions provide the emerging standard for consistent, cross-tool telemetry in AI workloads.
Implementation follows a four-step roadmap (assess, instrument, evaluate, iterate) that can be piloted in 30 days on a single production AI system.

AI semantic observability is the discipline of enriching AI telemetry with context, intent, and reasoning information so that teams can understand not just what an AI system did, but why it did it and whether the output was meaningful, trustworthy, and aligned with business expectations.
In plain language: Traditional observability tells you the system responded in 200 milliseconds. Semantic observability tells you whether the response was correct, used the right data sources, followed the right reasoning path, and complied with the right policies.
The distinction matters because AI systems, particularly generative AI (GenAI) and agentic systems, fail in ways that traditional telemetry cannot detect. A model that hallucinates a citation, an agent that drifts from its intended behavior, a RAG pipeline that retrieves the right documents but synthesizes them into a misleading conclusion: These are semantic failures that occur while every infrastructure metric remains green.
Core attributes that define semantic observability:
Shared schemas: Consistent naming conventions and data structures across all AI telemetry, so that a "prompt" means the same thing in every system's logs and a "groundedness score" is calculated the same way across every evaluation pipeline
Intent capture: Recording not just what the user asked,but what they meant and whetherthe system's interpretation matched. That gapbetween what was asked and what was meant is what lets teams evaluate relevance beyond simple keyword matching.
Evaluation loops: Automated quality checks that score outputs against defined criteria (accuracy, policy adherence, faithfulness) and feed results back into the monitoring system for trend analysis and alerting
Reasoning traces: Step-by-step records of the model's decision path: which documents were retrieved, how they were ranked, what intermediate conclusions were drawn, and how the final output was assembled
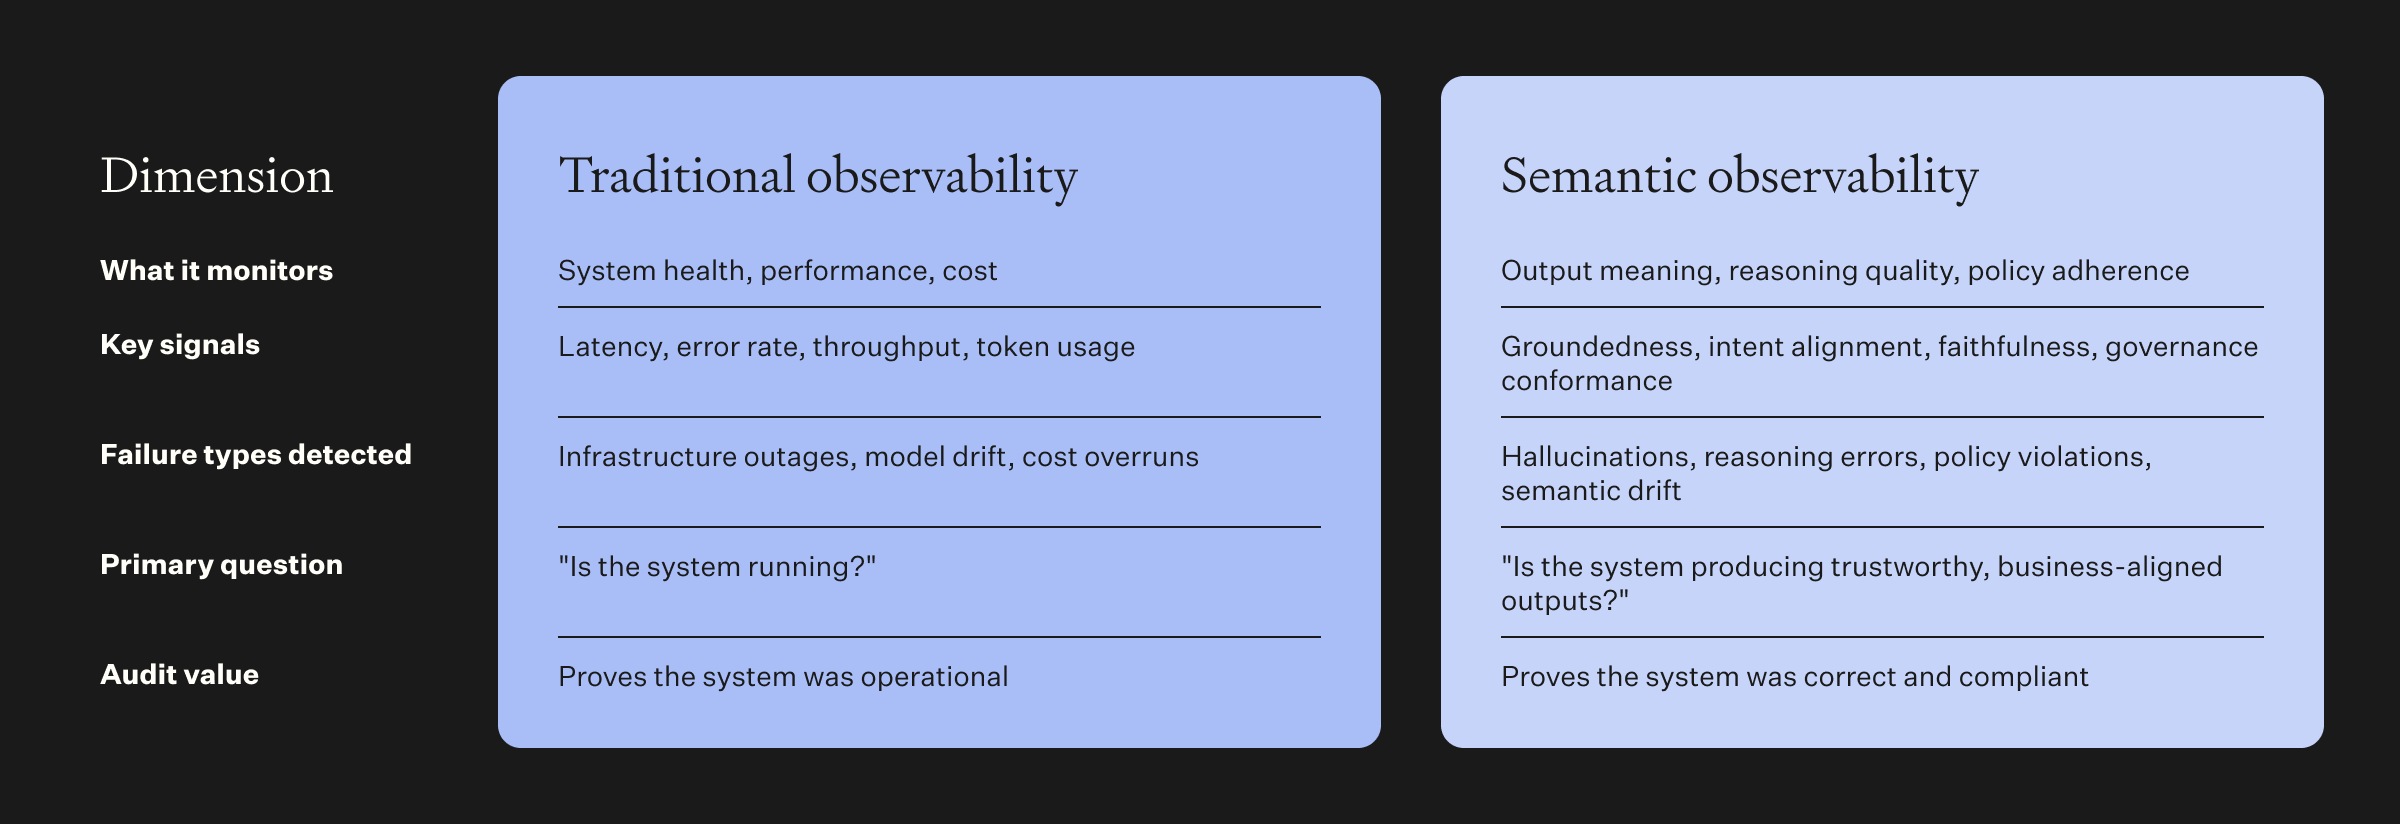
Click on the image above to zoom into full PDF
That gap between proving a system ran and producing evidence that its outputs met defined requirements is exactly why semantic observability is turning into a governance requirement rather than an engineering nice-to-have.
Enterprises need semantic observability because the risks of AI deployment have shifted from operational (Will the system stay up?) to semantic (Will the system produce outputs that are safe to act on?).
According to the "Global AI confessions report: data leaders edition," based on a Dataiku/Harris Poll survey of 800+ data leaders, 95% admit they cannot fully trace how their AI systems arrive at a decision, which is exactly the visibility gap this discipline is built to close.
Four risks drive adoption:
Hallucination risk: GenAI systems produce confident, fluent, wrong answers that traditional monitoring cannot detect. According to the "Global AI confessions report: data leaders edition," based on a Dataiku/Harris Poll survey, 59% of data leaders say AI hallucinations or inaccuracies have already caused business issues in the past year.
Bias risk: Outputs may systematically disadvantage certain groups in ways that aggregate accuracy metrics mask.
Regulatory risk: The EU AI Act, GDPR, and sector-specific regulations require evidence of output quality, reasoning traceability, and policy compliance that operational metrics alone cannot provide.
Trust risk: Users who receive inconsistent or unexplainable AI outputs stop trusting the system, regardless of its technical performance metrics.
Four benefits justify the investment:
Faster debugging: Reasoning traces pinpoint whether a failure occurred in retrieval, reasoning, or generation, reducing mean time to resolution (MTTR) from hours to minutes.
Auditability: Semantic telemetry produces the evidence that regulators and internal auditors require on demand.
Alignment: Evaluation loops catch outputs that drift from business expectations before they reach users.
Cost reduction: Focused telemetry that captures semantic signals eliminates the noise of logging everything while missing the signals that matter.
The following two illustrative examples show how this works.
A financial services chatbot begins recommending products that are not suitable for the customer's risk profile. Latency and accuracy metrics show no degradation. Semantic observability detects the issue through a policy adherence check: The recommendation engine is retrieving from a product catalog that was updated without corresponding updates to the suitability rules.
Time to detection: Four hours, versus three weeks when the same issue was discovered through customer complaints in the previous quarter
A healthcare triage agent starts routing medium-acuity patients to high-acuity pathways. Throughput metrics show increased volume in the high-acuity queue but do not flag a cause. Semantic observability traces the reasoning path and identifies that a recently updated clinical guideline changed the scoring for one symptom category, shifting the triage boundary. The guideline update was correct, but the agent's thresholds were not recalibrated.
Time to detection: Same day
The financial-services and healthcare examples above are typical of what the shift to semantic observability delivers: Detection is measured in hours instead of weeks, and evidence regulators and auditors can act on without a manual investigation.
Enterprises implementing semantic observability report significant reductions in MTTR for output-quality issues, measurable improvements in compliance pass rates during audits, and measurable increases in user trust scores.
The architecture organizes telemetry into four layers, data, model, behavior, and semantic, each capturing different signals and feeding into the next.
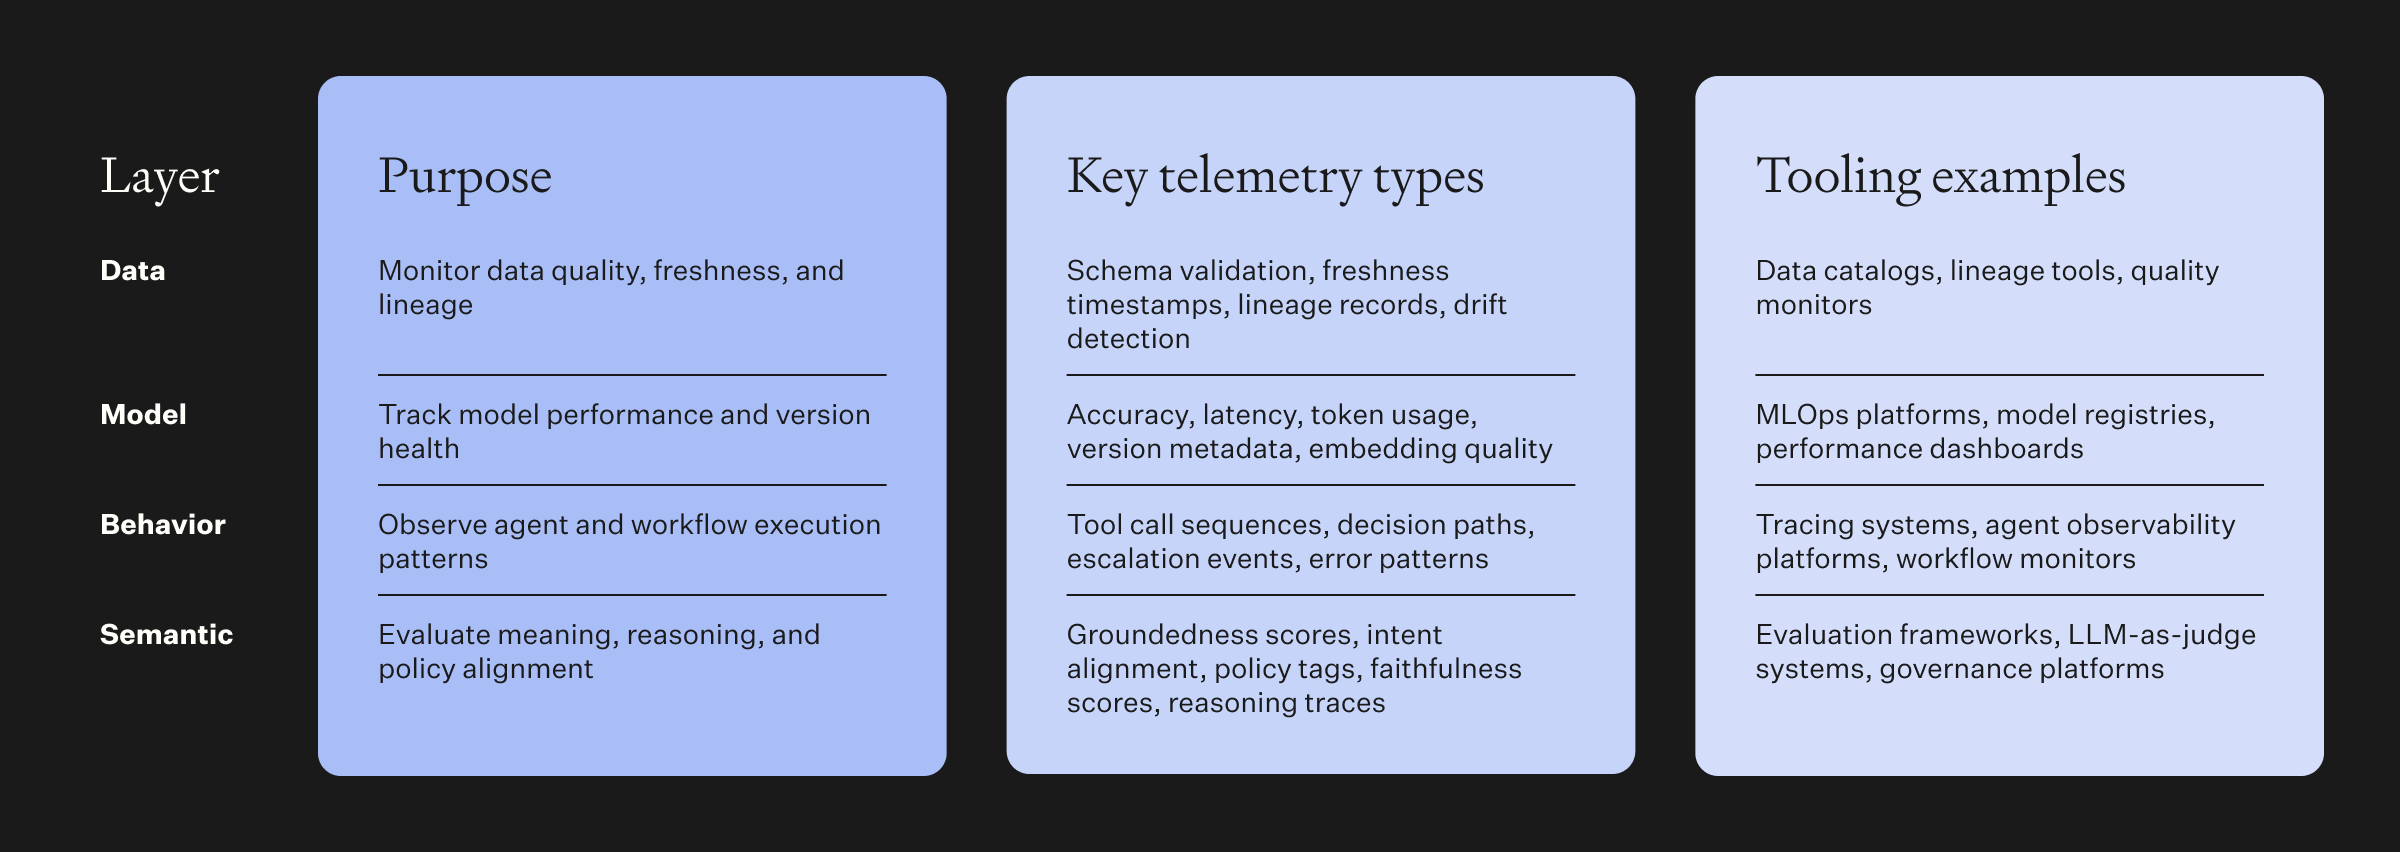
Click on the image above to zoom into full PDF
The layers interact through upward enrichment: Data-layer signals (Is the data fresh and valid?) inform model-layer evaluation (Is the model performing well on valid data?), which informs behavior-layer analysis (Is the agent making reasonable tool calls and decisions?), which feeds into semantic-layer assessment (Is the final output meaningful, trustworthy, and compliant?).
Reasoning traces are captured at the semantic layer but reference signals from every layer below.
A reasoning trace for a RAG pipeline output might show:
Data freshness: Document was last updated three days ago, within the seven-day freshness threshold.
Model performance: Retrieval relevance score 0.87, above the 0.80 threshold
Behavior: Agent retrieved five documents, ranked them, and selected the top three for context assembly.
Semantic evaluation:
Groundedness score 4.2/5.0
Policy adherence: Passed
Faithfulness: All claims cited
The thresholds and scores above are illustrative. Teams should define and validate thresholds against representative data for each use case rather than treating them as universal standards.
Feedbackloops close the architecture: semantic-layer findings (a pattern of declining groundedness on queries about a specific topic) trigger investigation at the data layer (Are the source documents for that topic stale?) and the model layer (Has retrieval relevance degraded for that query type?). Without these feedback loops, each layer operates in isolation, and root-cause analysis remains manual.
OpenTelemetry semantic conventions and the Elastic Common Schema (ECS) are the two standards that support semantic observability today. Both exist because, without shared naming conventions and data structures, telemetry from different systems uses different names for the same signals, which makes aggregation, correlation, and analysis impractical.
OpenTelemetry semantic conventions are the emerging standard. OpenTelemetry provides vendor-neutral instrumentation for traces, metrics, and logs. Its semantic conventions define standardized attribute names for AI workloads, ensuring that telemetry from different tools and platforms uses consistent naming.
Must-know attributes for AI workloads:
gen_ai.system: The AI system being observed (e.g., "openai", "anthropic", "dataiku")
gen_ai.request.model: The model used for the request
gen_ai.usage.input_tokens / gen_ai.usage.output_tokens: Token consumption
gen_ai.prompt.id: Unique identifier for the prompt template
gen_ai.response.id: Unique identifier for the generated response
For semantic observability specifically, teams should extend the standard with custom attributes:
semantic.groundedness_score: Evaluation score for factual grounding
semantic.policy_adherence: Pass/fail flag for each applicable policy check
semantic.intent_alignment: Score for how well the output matched user intent
semantic.context_vector_id: Identifier linking the output to its retrieval context
semantic.prompt_template_id: Unique identifier for the prompt template version, enabling correlation between outputs and the specific prompt that generated them
ECS provides a complementary naming convention used in Elasticsearch-based observability stacks. OpenTelemetry focuses on instrumentation, whereas ECS focuses on storage and search. Teams running both can map between the two using field aliases.
Privacy and data sanitization: Semantic telemetry inherently contains content-level data (prompts, responses, reasoning traces). Sanitization must happen before storage: PII redaction, sensitive content masking, and compliance with data retention policies. Log everything the governance program needs. Log nothing it does not.
A four-step roadmap sequences the implementation from assessment through continuous iteration.
Audit current observability coverage. Identify which AI systems are in production, what telemetry they generate, and where the gaps are between operational monitoring and semantic evaluation. Map the gaps to the four architecture layers.
Deliverable: An observability gap analysis with prioritized remediation targets
Teams involved: DevOps, AI engineering, compliance
Add semantic telemetry to the highest-priority AI system identified in the assessment. Adopt OpenTelemetry semantic conventions for consistent attribute naming. Capture reasoning traces, policy tags, and evaluation signals alongside existing operational telemetry.
# Example: OpenTelemetry auto-instrumentation for LLM calls
from opentelemetry import trace
from opentelemetry.sdk.trace import TracerProvider
provider = TracerProvider()
trace.set_tracer_provider(provider)
tracer = trace.get_tracer("ai.semantic.observability")
with tracer.start_as_current_span("llm_inference") as span:
   span.set_attribute("gen_ai.request.model", "your-model-name")
    span.set_attribute("gen_ai.usage.input_tokens", 1200)
    span.set_attribute("gen_ai.usage.output_tokens", 450)
    span.set_attribute("semantic.groundedness_score", 4.2)
    span.set_attribute("semantic.policy_adherence", "passed")
    span.set_attribute("semantic.intent_alignment", 0.91)
    # ... model inference and response handling
Teams involved: AI engineering, DevOps, data engineering
Configure automated evaluation loops that score outputs against defined quality criteria: groundedness, faithfulness, policy adherence, and intent alignment. Set alert thresholds for each metric, route alerts to the appropriate stakeholder, and establish human review processes for flagged outputs.
Teams involved: AI engineering, compliance, business stakeholders
Review evaluation results monthly, and refine scoring criteria based on false positive and false negative rates. Update semantic conventions as new AI systems are onboarded, and expand coverage from the pilot system to adjacent systems. Establish quarterly governance reviews that use semantic observability data as the primary evidence base.
Teams involved: All of the above, plus executive sponsors for governance reviews
Governance integration: Version-control all schema definitions and evaluation criteria. Changes to scoring thresholds or policy tags should follow the same review process as production code changes. Alignment reviews (quarterly) verify that semantic observability metrics still reflect business expectations.
Rollout readiness checklist:
OpenTelemetry SDK installed and configured
Semantic attributes defined and documented
Evaluation criteria set with alert thresholds
Human review process established for flagged outputs
Data sanitization pipeline verified for PII compliance
Storage retention policies aligned with regulatory requirements
Dataiku Agent Management, offered by Dataiku, the Platform for AI Success, provides a single view of business performance, behavioral drift, and governance status across agents on any platform, serving as the enterprise layer that connects semantic observability signals to governance action and business outcome measurement.
The three cases below span a chatbot, a fraud model, and a research assistant, but the same pattern shows up in each: Every infrastructure metric looked fine while the output quietly stopped being trustworthy.
Problem: A customer-facing chatbot began providing inconsistent answers about product return policies. Satisfaction scores dropped 12% over two weeks with no corresponding change in latency or error rates.
Semantic telemetry applied: Reasoning trace analysis revealed that the RAG pipeline was retrieving documents from two different policy versions: a current version and a deprecated version that had not been removed from the knowledge base. The groundedness evaluation showed a 15% decline in policy-adherence scores for return-related queries.
Outcome: Once the deprecated documents were removed, policy-adherence scores recovered to baseline within 48 hours, and a freshness check was added to the retrieval pipeline so the same failure couldn't recur silently.
Lesson: Document lifecycle management is a semantic observability requirement, not just a content management task.
Problem: A transaction monitoring model began flagging 40% more transactions as suspicious without a corresponding increase in actual fraud. The false-positive spike consumed analyst capacity and delayed legitimate transaction processing.
Semantic telemetry applied: Behavioral-layer analysis showed that the model's feature weights had shifted after a routine retraining cycle. Semantic-layer evaluation revealed that the model was weighting a seasonal purchasing pattern as anomalous because the retraining data did not include the previous year's seasonal data.
Outcome: After the retraining dataset was corrected to include full seasonal coverage, false-positive rates returned to baseline. The team also configured a semantic drift alert to fire whenever feature-weight distributions shift beyond defined thresholds post-retraining, so the same gap gets caught before it reaches production.
Lesson: Retraining validation requires semantic evaluation, not just performance metric comparison.
Problem: An internal research assistant began surfacing irrelevant documents in response to technical queries. Usage dropped 25% as researchers reverted to manual search.
Semantic telemetry applied: Intent-alignment scoring showed a decline from 0.89 to 0.62 over four weeks. Reasoning trace analysis identified the cause: A vector index refresh had failed silently three weeks earlier, causing the retrieval system to operate on stale embeddings that no longer reflected recent document additions.
Outcome: Refreshing the vector index brought intent-alignment scores back within 24 hours, and the team added an automated freshness check with alerting on refresh failures to close the gap for good.
Lesson: Infrastructure failures that do not produce errors can cause semantic degradation that only semantic observability detects.
Four challenges appear consistently during implementation: schema drift, storage cost, sensitive data leakage, and alert fatigue, each with its own mitigation practice.
As AI systems evolve, telemetry attribute names and definitions drift across teams and systems. A "groundedness_score" calculated differently in two pipelines produces conflicting signals.
Mitigation: Version-control all schema definitions. Treat schema changes as breaking changes that require review and migration.
Semantic telemetry (reasoning traces, evaluation scores, policy tags) generates far more data volume than operational telemetry captures alone.
Mitigation: Implement tiered storage (hot storage for recent traces, cold storage for audit archives) and sampling strategies (full semantic evaluation on a representative sample, lightweight checks on every output).
Reasoning traces and evaluation logs inherently contain content-level data that may include PII, proprietary information, or regulated data.
Mitigation: Apply PII redaction before storage. Define what content-level data the governance program requires and exclude everything else. Treat semantic telemetry with the same data classification and access controls as the production data it describes.
Too many low-priority semantic alerts train teams to ignore the system.
Mitigation: Implement evaluation gating (only generate alerts for outputs that fail multiple evaluation criteria, not single-criteria failures) and tune thresholds based on the first 30 days of production data rather than pre-deployment estimates.
Best practices summary:
Version-control schemas and evaluation criteria.
Implement tiered storage with sampling.
Redact PII before logging.
Tune alert thresholds against real production data.
Review the full semantic observability configuration quarterly.
Semantic observability adds a meaning layer to the metrics, logs, and traces that traditional observability already captures. It transforms AI monitoring from "Is the system running?" to "Is the system producing trustworthy, business-aligned outputs?" and creates the audit evidence that governance programs require.
Three actions to start this quarter:
Adopt a defined version of the OpenTelemetry semantic conventions as the naming standard for all AI telemetry.
Pilot one evaluation loop on the highest-risk production AI system using the four-step roadmap.
Set task-specific service-level objectives (SLOs)for groundedness and policy adherence and review results at the 30-day mark.
Dataiku embeds observability and governance across the AI lifecycle so teams can scale AI with confidence that what their systems produce is as well-monitored as how they perform.
*Gartner Newsroom, Gartner Predicts 40% of Organizations Deploying AI Will Use AI Observability to Monitor Model Performance by 2028, May 12, 2026. GARTNER is a trademark of Gartner, Inc. and its affiliates.
Semantic observability detects risks traditional monitoring misses: hallucinations, policy violations, reasoning drift, and intent misalignment. Catching these in real time, rather than through audits or complaints, cuts time-to-detection from weeks to hours and produces the audit evidence regulators require on demand.
Start with the four-step roadmap: Assess gaps, instrument the highest-priority system with semantic telemetry, configure evaluation loops with alert thresholds, and iterate. Most implementations do not require replacing existing observability infrastructure; semantic telemetry layers on top through added attributes and evaluation pipelines.
AI evaluation frameworks (LLM-as-judge, human rubric review, benchmark testing) are the scoring mechanisms. Semantic observability is the operational infrastructure that runs those evaluations continuously in production, stores results, tracks trends, and triggers alerts when scores degrade.
Not directly. Semantic observability does not change model outputs. It detects when outputs degrade and supplies the reasoning traces and evaluation scores needed to find the root cause.
It detects the issue, the team diagnoses the cause, a fix is applied (prompt, data, or model change), and semantic observability confirms the fix restored quality. Skip this loop, and degradation persists until users or auditors catch it.
Start with four metrics: groundedness score, policy adherence rate, intent alignment score, and semantic drift rate. These give baseline coverage. As the program matures, add faithfulness, coverage, and governance conformance.
Tags