Agentic AI observability: monitoring multi-step reasoning chains
October 6, 2026/7 min read/Team Dataiku
An agent that completes a task in two seconds with zero errors may have called the wrong tool, accessed unauthorized data, looped three times before converging, or drifted from the user's original intent. But none of those failures appear in latency, throughput, or error rate dashboards.
This is the observability gap that agentic AI creates. While infrastructure monitoring can confirm that the agent ran, it does not by itself reveal how the agent executed the task, whether it chose appropriate tools and actions, or whether the outcome aligned with the original goal.
Gartner® states, "33% of enterprise software applications will include agentic AI by 2028, up from less than 1% in 2024."* At that scale, the difference between organizations that can explain what their agents did and organizations that cannot is a governance and liability question.
This guide covers the telemetry foundations, monitoring techniques, five-step implementation blueprint, and governance practices organizations can use to make autonomous agents more measurable, debuggable, and accountable in production.
Agentic AI observability is the systematic monitoring of autonomous agents across planning, decision, action, and feedback loops, instead of just the infrastructure they run on.
Three telemetry pillars (metrics, events and logs, traces) adapt MELT principles to agent-specific signals: task success rates, tool call sequences, and multi-step reasoning traces.
Monitoring multi-step agent workflows requires checkpoints at input parsing, tool selection, and result validation, each mapped to a specific telemetry pillar.
A five-step implementation blueprint sequences the work from instrumentation through KPI dashboards and threshold-based alerting.
According to "Global AI confessions report: data leaders edition," based on a Dataiku/Harris Poll survey of 800+ global data leaders, 75% say trust in their agent deployments is a concern. Observability can turn that concern into measurable signals teams can investigate and govern.
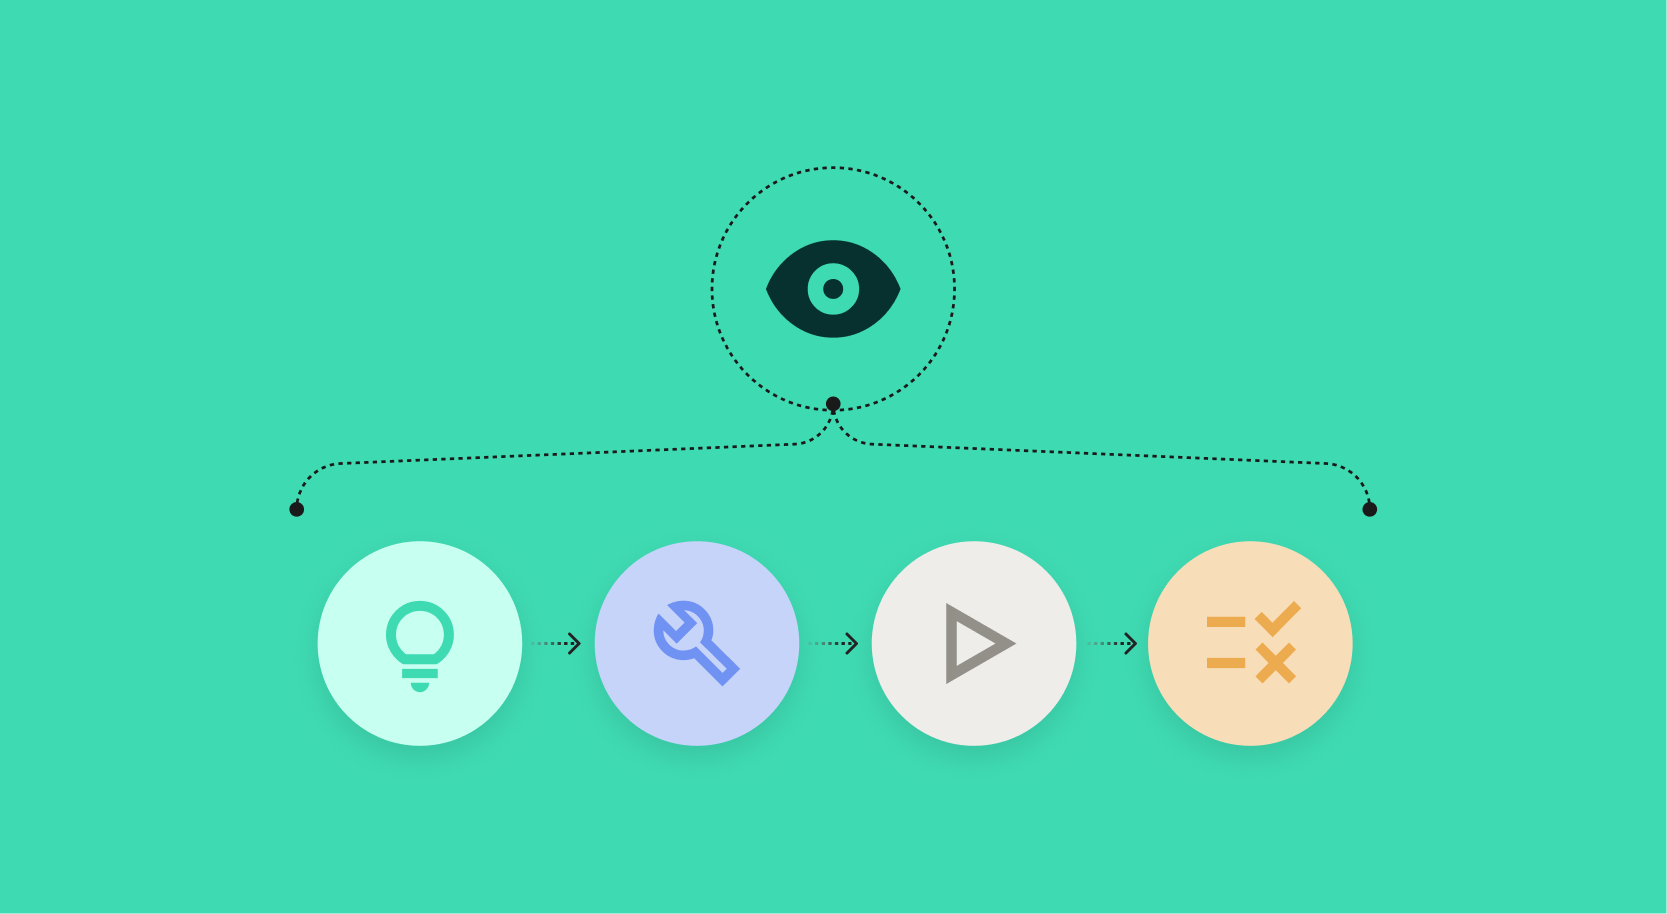
Agentic AI observability is the practice of systematically monitoring autonomous AI agents across their planning, decision-making, action execution, and feedback loops to ensure they operate correctly, efficiently, and within governance boundaries.
The gap it fills: Traditional infrastructure monitoring (CPU utilization, API latency, error rates) confirms the agent's compute environment is healthy. Agentic observability provides signals about the agent's behavior: whether it selected appropriate tools, followed the expected workflow, and produced an outcome aligned with the task.
An agent's reasoning quality can degrade over time as data distributions shift, model versions update, or prompt configurations drift. Without observability into the agent workflow itself, degradation may surface through user complaints only after it has persisted, rather than through earlier monitoring signals.
Agents that access unauthorized data, take actions outside their defined scope, or produce outputs that violate policy create regulatory exposure. Observability at the tool-call and data-access level can surface these violations as they occur, rather than relying solely on retrospective audits.
Agents that loop, retry excessively, or call expensive models for simple tasks escalate token costs without corresponding value. A model sized for complex reasoning applied to a simple lookup burns tokens on every call, and that inefficiency compounds silently across thousands of daily runs until someone finally reconciles the bill against actual task volume.
A procurement agent receives a request to find alternative suppliers. It calls the supplier database API with an incorrect filter parameter, retrieving suppliers from the wrong product category. The agent confidently presents the results, and infrastructure metrics show a successful API call with 120ms latency. The agent logged a completed task. But the recommendations are wrong, and no monitoring layer detected the error because no observability was applied at the tool-call semantics level.
MELT (Metrics, Events, Logs, Traces) is the established observability framework. For agentic systems, each pillar adapts to capture agent-specific signals tied to decision quality rather than just system health.
Three high-value metrics anchor agentic observability.
Task success rate: Percentage of agent runs that achieve the defined goal, verified against end state rather than just completion status; a declining success rate signals reasoning degradation before users report it.
Token cost per operation: Total token consumption (input + output) per completed task; a spike in cost-per-task without a corresponding increase in task complexity signals inefficiency: the agent is looping, retrying, or using an oversized model for the task.
Agent latency (P95): End-to-end time from task initiation to completion, broken down by reasoning phase; a latency increase isolated to the planning phase (while execution latency remains stable) points to a prompt or context issue, not an infrastructure issue.
Example: Token cost per operation doubles over two weeks. Trace analysis reveals the agent started calling a frontier model for a classification subtask that a smaller model handled previously. The configuration change was unintentional (a prompt template update removed the model routing instruction). A metric spike led to a trace investigation, which led to the root cause in under an hour.
Three event categories matter most for AI agent monitoring.
Tool call events: Which tool was called, with what parameters, and what was returned; this is where the procurement agent's incorrect filter parameter would have been caught. The tool call event log shows the parameter value, and a validation rule flags it as outside the expected range.
Human handoff events: When and why the agent escalated to a human, what context was provided, and what decision the human made; these events feed governance reporting and escalation-rate tracking.
Decision logs: Structured records of the agent's intermediate reasoning: what options it evaluated, what it selected, and why. JSON-structured logging is essential for queryability. Depending on the application, a decision log might include the step number, options considered, selected action, recorded rationale, and confidence or evaluation score.
Personally identifiable information (PII) compliance note: Agent logs frequently contain user inputs that may include personal information. Apply PII redaction at the logging layer, before storage.
Traces in agentic systems can capture parent-child span relationships across a multi-step agent workflow.
A multi-step agent workflow generates a trace with a parent span (the overall task) and child spans for each phase:
Planning: Analyzing the request, decomposing into subtasks
Tool selection: Choosing which tools to call for each subtask
Execution: Calling tools, processing responses
Validation: Checking the output against quality criteria
The parent-child relationship is what makes multi-step debugging possible. When a task fails, the trace shows exactly which phase failed, what happened in that phase, and what the agent's state was at that point.
OpenTelemetry semantic conventions for GenAI define standardized attribute names for agent telemetry (gen_ai.system, gen_ai.request.model, gen_ai.usage.input_tokens). Adopting these conventions from the start improves interoperability of telemetry across tools and teams. The OpenTelemetry GenAI semantic conventions spec is actively maintained and evolving as agent patterns mature.
Agentic workflows follow a repeating loop: plan, select tools, execute, verify results. Each iteration may trigger another loop if the result is unsatisfactory. Three useful checkpoints are input parsing, tool selection, and result validation, each of which can be tied to telemetry.
Verify that the agent correctly interpreted the user's request before it begins planning. Measure intent alignment between the parsed input and the original query. A low alignment score at this checkpoint prevents the agent from executing an entire workflow based on a misunderstood request.
Log every tool selection decision: which tools were available, which was selected, what parameters were passed, and what the selection rationale was. This is where AI pipeline observability catches incorrect tool calls before they propagate through the rest of the chain. Combined with validation rules or anomaly detection, these logs can surface questionable tool selections or parameters before their effects propagate through later steps.
After each execution step, score the result against expected quality criteria:
Groundedness: Is the result supported by the data?
Relevance: Does the result address the original request?
Policy adherence: Does the result comply with governance rules?
These scores, captured as span attributes in the trace, provide the evidence for both debugging and compliance.
Together, the three checkpoints provide a more complete view of the workflow:The agent understood the request correctly (input validation), chose the right tools (selection logging), and produced a quality result (validation scoring). When any checkpoint fails, the trace shows exactly where in the chain the failure occurred.
Five steps sequence the implementation from first instrumentation to production-grade observability.
Add tracing to agent workflows where step-level observability is needed.Capture a parent span for the overall task and child spans for each planning, tool-call, and validation step.
rom opentelemetry import trace
tracer = trace.get_tracer("agent.observability")
with tracer.start_as_current_span("agent_task") as parent:
    parent.set_attribute("agent.task_type", "supplier_search")
    with tracer.start_as_current_span("planning"):
        # Agent planning logic
        pass
    with tracer.start_as_current_span("tool_execution"):
        # Tool call with parameter logging
        pass
    with tracer.start_as_current_span("validation"):
        # Result quality scoring
passSend traces to a centralized backend:
Jaeger: Open-source, self-hosted
Honeycomb: Managed, high-cardinality analysis
Grafana Tempo: Open-source, integrates with Grafana dashboards
The backend must support high-cardinality queries because agent traces contain unique attributes per run (user IDs, session IDs, tool parameters).
Enrich traces with relevant context metadata, such as user ID, session ID, agent version, and business context (department, use case, risk tier). This metadata enables filtering and correlation: "Show me all traces where the procurement agent called the supplier API for the electronics category in the last 24 hours."
Connect operational telemetry (task success rate, latency, cost) to business outcomes (tickets resolved, exceptions processed, recommendations accepted). The dashboard should answer both "Is the agent running correctly?" and "Is the agent delivering business value?"
Configure alerts on the three core metrics (task success rate, token cost per operation, P95 latency) and on agent behavior tracking signals (tool call error rate, escalation frequency, reasoning loop count). For example, teams might begin with warning and critical thresholds based on deviations from an established baseline, then tune them using observed variability and business risk.
Turnkey options for teams wanting faster setup: Langfuse provides open-source LLM observability with native agent tracing support. Weights & Biases Weave provides experiment tracking alongside production monitoring.
Six KPIs define agentic AI observability at the operational and business level. The thresholds below are illustrative starting points and should be calibrated to the agent, use case, baseline variability, and consequence of failure.
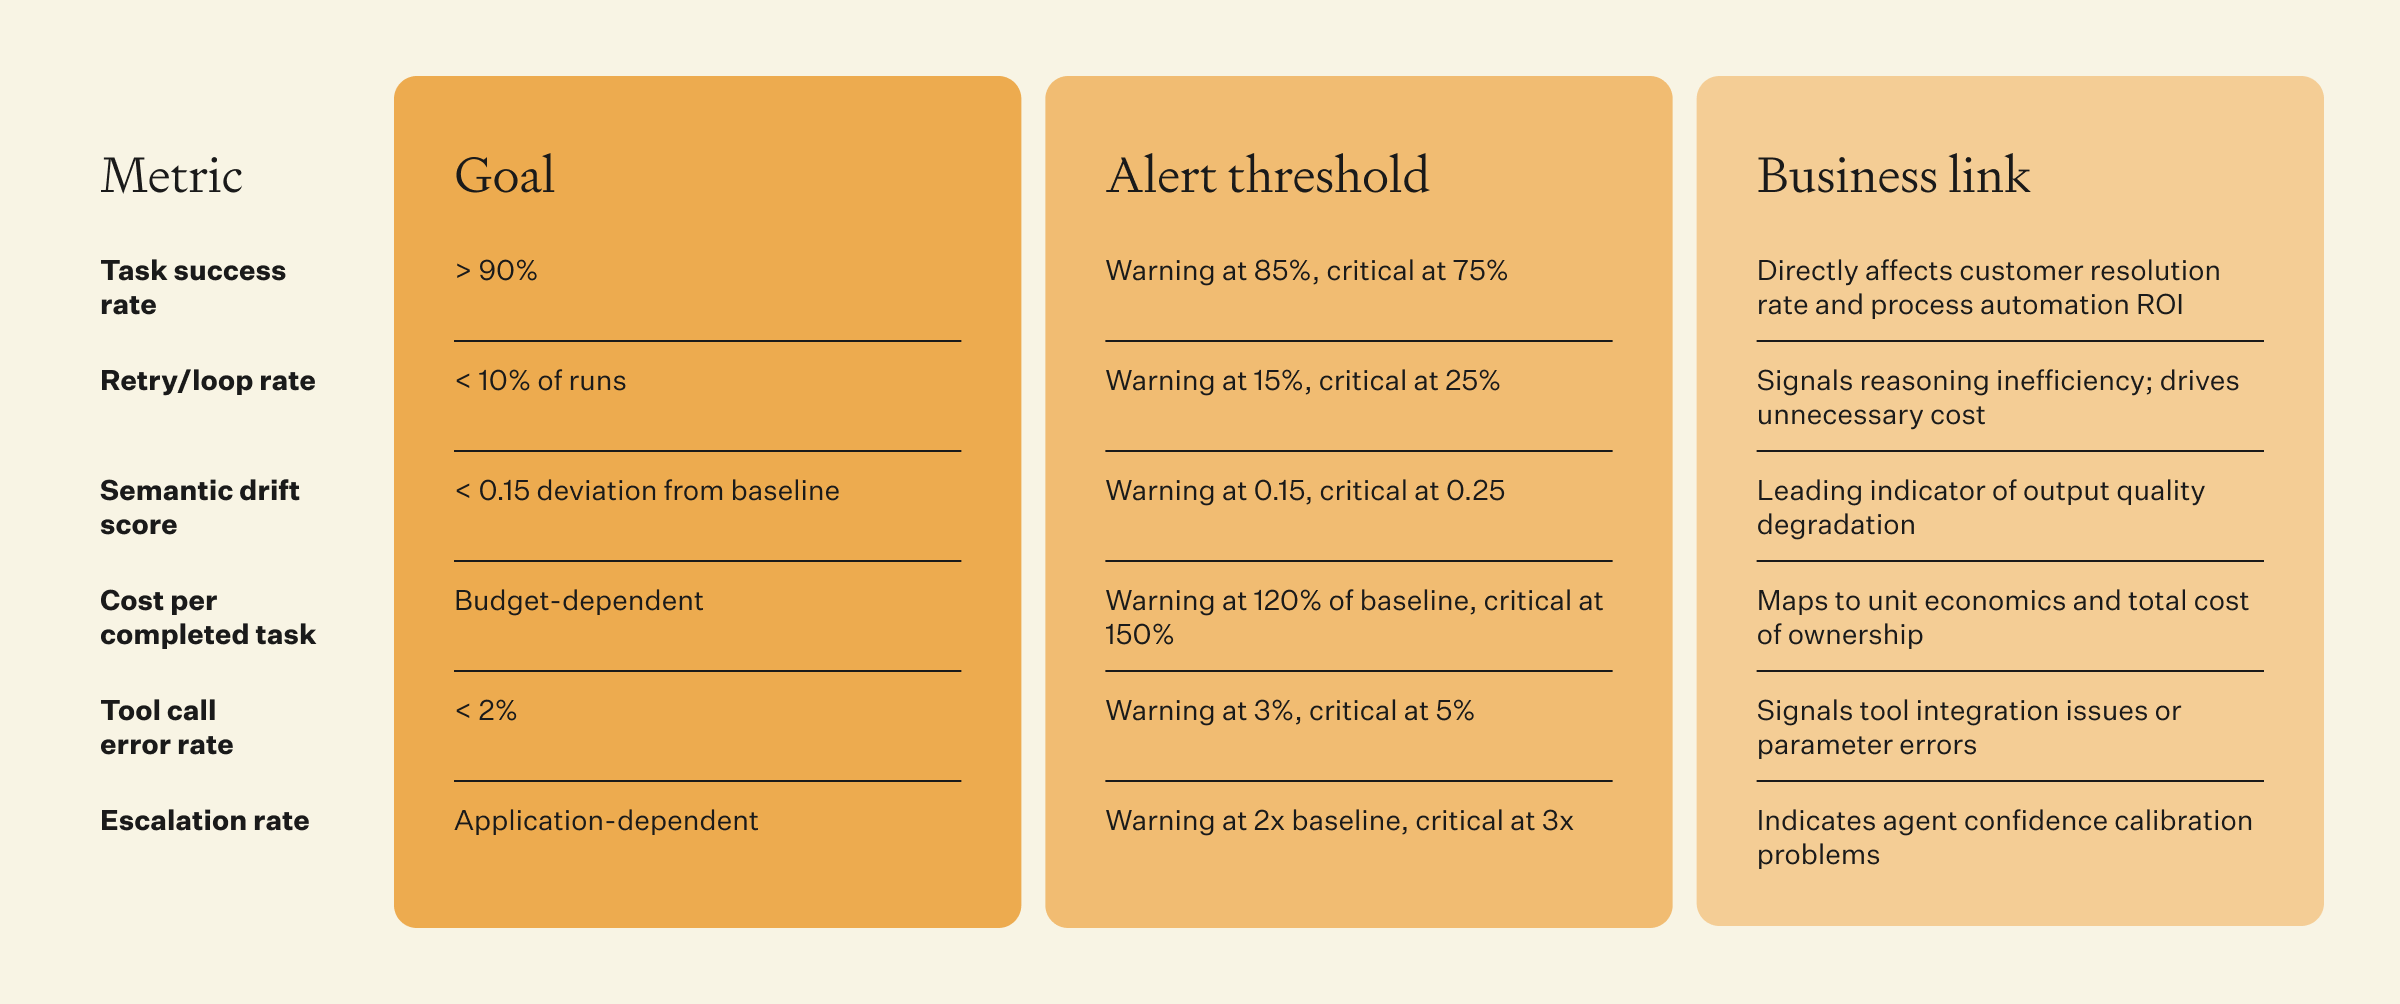
Click on the image above to zoom into full PDF
The critical practice: Link operational metrics to executive KPIs. A task success rate of 92% has limited meaning to an executive without business context. "The procurement agent successfully processed 92% of supplier evaluations without human intervention, saving 340 analyst-hours this month" connects the operational metric to an outcome the business can evaluate.
Dataiku, the Platform for AI Success, provides Agent Management that links operational metrics to business KPIs, flagging agents that are technically healthy but missing their business targets. This closes the gap between "the agent is running" and "the agent is working."
Unmonitored agents pose three compounding risks:
Decision integrity degrades silently.
Compliance violations accumulate without detection.
Cost escalation continues until someone notices the bill.
Agentic AI observability makes these risks easier to detect, measure, investigate, and manage.
The benefits are concrete:
Faster debugging: Traces pinpoint failures to specific reasoning steps
Regulatory readiness: Logged tool calls and decision records can provide evidence for audit and governance processes
Operational confidence: KPI dashboards provide evidence that agents are delivering value, not just running
Start with one agent and one telemetry pillar. Instrument traces for a single production agent this week. Measure task success rate and cost per completion. Set alert thresholds based on the first week's baseline. Expand from results.
Dataiku extends observability with governance so autonomous agents stay accountable: every tool call logged, every decision traceable, every business outcome measured.
Traditional monitoring tracks infrastructure health: CPU, latency, and error rates. Agentic observability tracks agent behavior: whether agents chose appropriate tools, followed expected workflows, and produced outcomes aligned with the task. Infrastructure can be healthy while agent behavior is not.
Multi-step agents chain planning, tool calls, and validation across multiple iterations. A failure in step three of a seven-step chain is invisible at the endpoint level. Step-level tracing with parent-child spans makes each reasoning step individually inspectable.
Start with task success rate (Are agents completing goals?), cost per completed task (Are they efficient?), and tool call error rate (Are they using tools correctly?). Add semantic drift scoring and escalation rate tracking as the observability program matures.
By capturing relevant tool calls, data access events, and decision metadata, observability can contribute to the audit trail organizations use for governance and compliance.EU AI Act Article 14 mandates human oversight for high-risk systems. For requirements such as human oversight of high-risk AI systems, observability can provide operational evidence that supports oversight and review processes.
OpenTelemetry for vendor-neutral instrumentation. Jaeger, Honeycomb, or Grafana Tempo for trace backends. Langfuse for LLM-native observability. Dataiku Agent Management for linking operational metrics to business KPIs across agent fleets.