


Flow
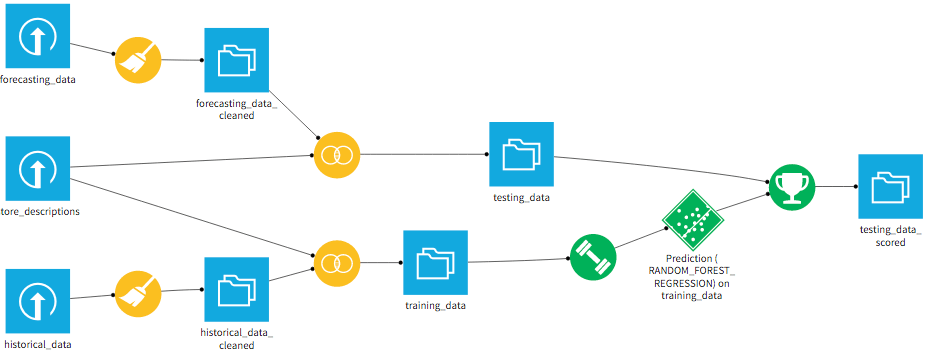
Start by looking at the flow and visualising the different steps of the project. You can see the preparation steps in yellow and the predictive modelling steps in green.
EXPLORE !
This sample project is based on data from a Kaggle challenge.
Many retail businesses need accurate forecasting of the revenue produced by each of their stores. These forecasts allow for planning, staffing optimization, as well as sure that each store has the necessary supply. Without these forecasts, businesses may waste money by overstocking a store, or worse yet, lose out on revenue because a store does not have enough supplies to handle predicted revenue.
In this project, we use historical data from the Rossman pharmacy chain to build a predictive model to forecast the revenue of each of their stores. This model can be run weekly or monthly and provide business actors with accurate predictions about the revenue for coming days or weeks. This information can then be used to optimize business practices and streamline operations.
We want to build a project to answer the following questions:
We start with 2 different data sources:
Like many data projects, we then proceed with three steps:
Let’s go through each one of those steps in more detail to see what we did.
Start by looking at the flow and visualising the different steps of the project. You can see the preparation steps in yellow and the predictive modelling steps in green.
EXPLORE !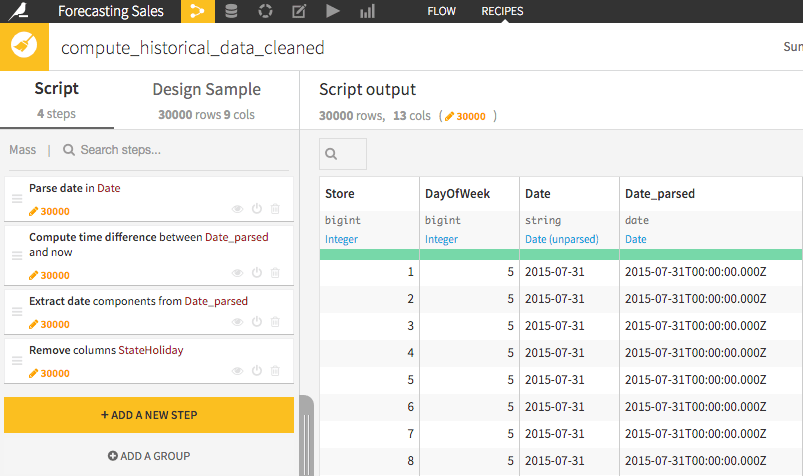
We used a preparation script to parse dates and engineer features from them. This is a data type common to many datasets, when the relevant data from a column has to be extracted to be useful.
EXPLORE !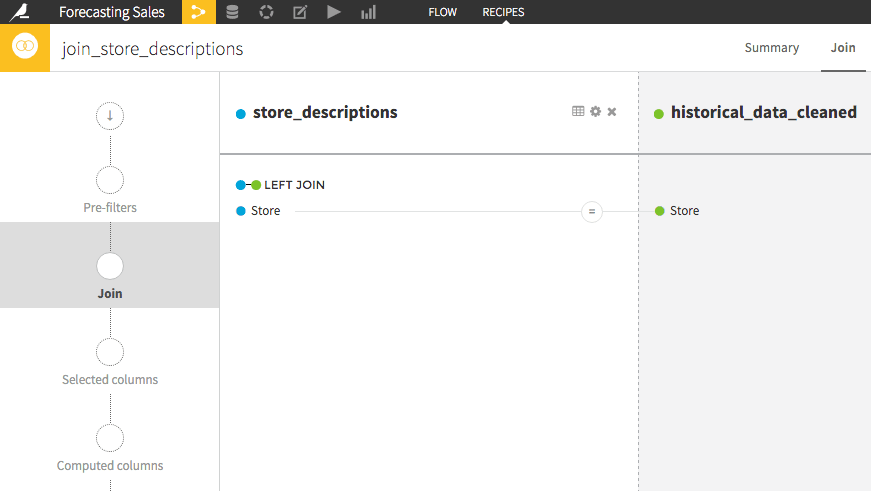
We then used a join recipe to *enrich our data* with meta-data about each store. This gives us more features that will be fundamental for the next step: predictive modelling.
EXPLORE !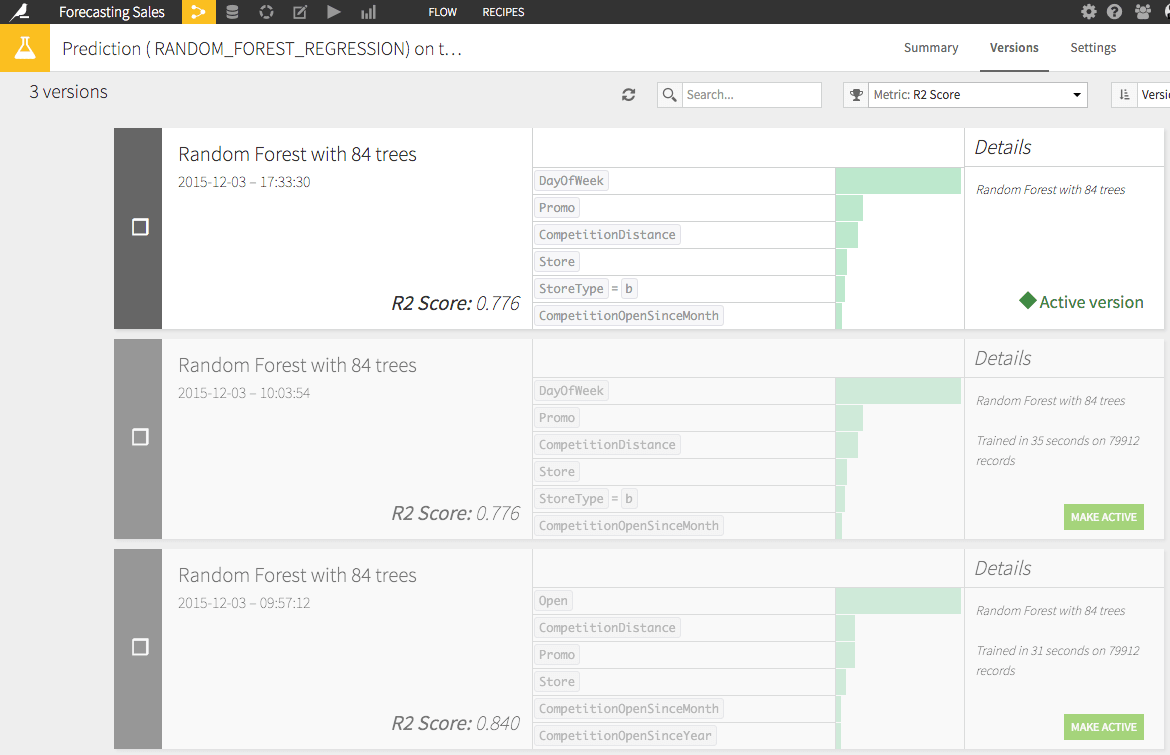
We built a model to predict the revenue for each store with an accuracy as high as possible. This project can be used in production to regularly produce forecasts for the coming week or month for a business. The business can then use these number to optimize staffing or stocks at each store.
EXPLORE !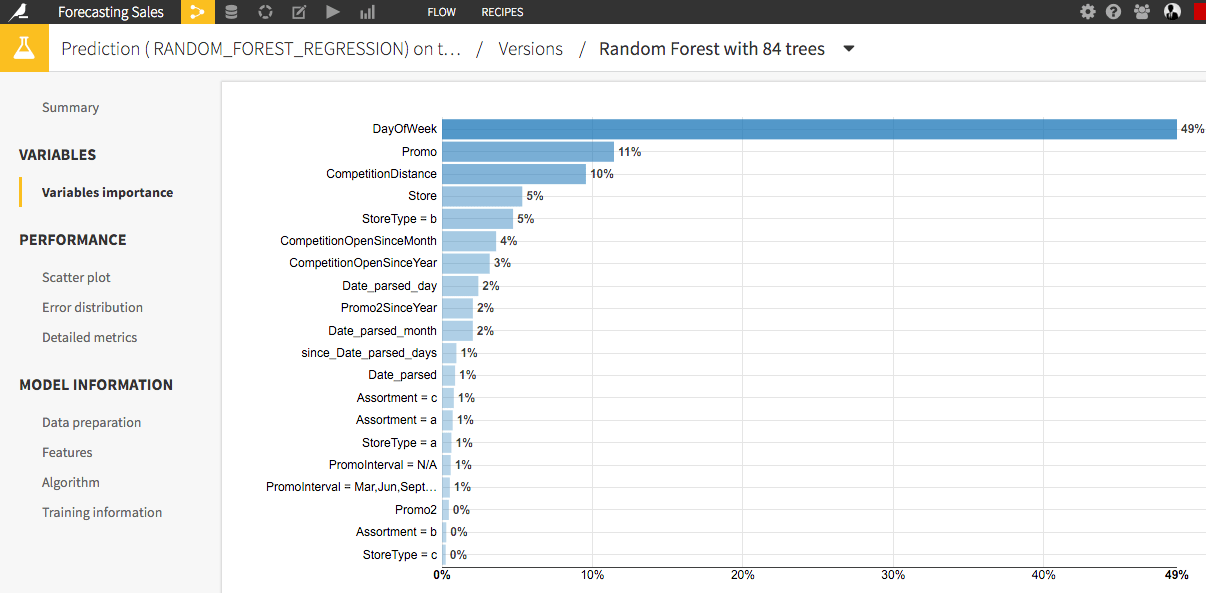
We can check the variables importance to see which factors are more important in predicting each store's revenue. After looking at this we can see that the most important predictors for revenue are:
- The day of the week
- Whether there's a sale or not
- How far the store is from a competitor's store
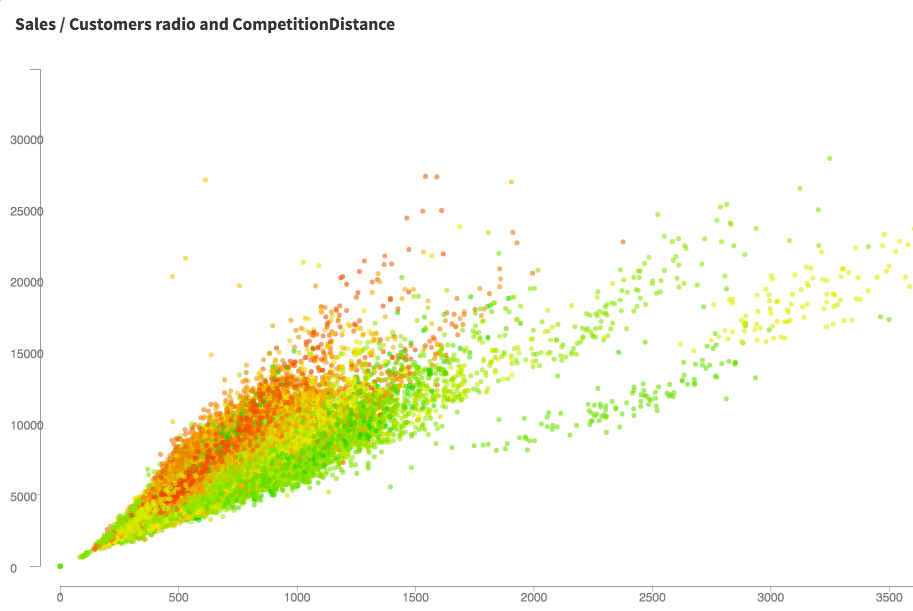
To communicate on our model's results, we built a dashboard with visualizations of the predictive model. Rather than looking at an excel-style table, these visualizations allow a team to easily get a quick feel for the data and the revenue forecasts.
EXPLORE !